Palestinian vs Bahamian In Labor Force | Age 35-44
COMPARE
Palestinian
Bahamian
In Labor Force | Age 35-44
In Labor Force | Age 35-44 Comparison
Palestinians
Bahamians
84.7%
IN LABOR FORCE | AGE 35-44
89.7/ 100
METRIC RATING
129th/ 347
METRIC RANK
84.7%
IN LABOR FORCE | AGE 35-44
93.2/ 100
METRIC RATING
115th/ 347
METRIC RANK
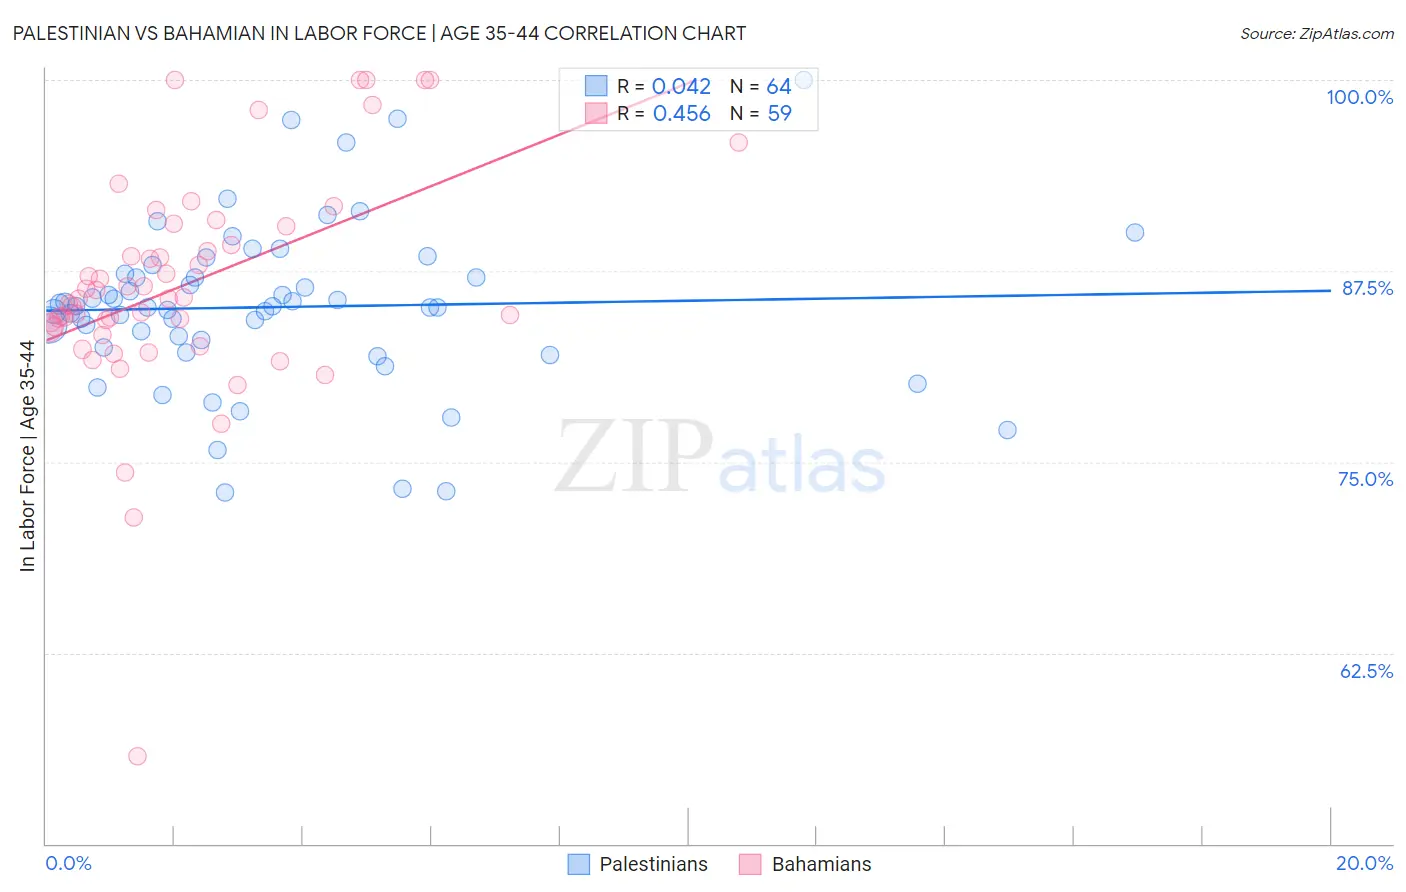
Palestinian vs Bahamian In Labor Force | Age 35-44 Correlation Chart
The statistical analysis conducted on geographies consisting of 216,394,739 people shows no correlation between the proportion of Palestinians and labor force participation rate among population between the ages 35 and 44 in the United States with a correlation coefficient (R) of 0.042 and weighted average of 84.7%. Similarly, the statistical analysis conducted on geographies consisting of 112,616,837 people shows a moderate positive correlation between the proportion of Bahamians and labor force participation rate among population between the ages 35 and 44 in the United States with a correlation coefficient (R) of 0.456 and weighted average of 84.7%, a difference of 0.070%.
In Labor Force | Age 35-44 Correlation Summary
| Measurement | Palestinian | Bahamian |
| Minimum | 73.0% | 55.7% |
| Maximum | 100.0% | 100.0% |
| Range | 27.0% | 44.3% |
| Mean | 85.1% | 86.6% |
| Median | 85.2% | 85.7% |
| Interquartile 25% (IQ1) | 82.7% | 83.7% |
| Interquartile 75% (IQ3) | 87.2% | 90.4% |
| Interquartile Range (IQR) | 4.5% | 6.7% |
| Standard Deviation (Sample) | 5.4% | 7.4% |
| Standard Deviation (Population) | 5.3% | 7.3% |
Demographics Similar to Palestinians and Bahamians by In Labor Force | Age 35-44
In terms of in labor force | age 35-44, the demographic groups most similar to Palestinians are Bhutanese (84.7%, a difference of 0.0%), Immigrants from Scotland (84.7%, a difference of 0.0%), Austrian (84.7%, a difference of 0.0%), Immigrants from Ghana (84.7%, a difference of 0.010%), and German (84.7%, a difference of 0.020%). Similarly, the demographic groups most similar to Bahamians are Immigrants from Western Africa (84.7%, a difference of 0.0%), Uruguayan (84.7%, a difference of 0.0%), Chilean (84.7%, a difference of 0.0%), Immigrants from Egypt (84.7%, a difference of 0.010%), and Immigrants from China (84.7%, a difference of 0.020%).
| Demographics | Rating | Rank | In Labor Force | Age 35-44 |
| Immigrants | Western Africa | 93.4 /100 | #112 | Exceptional 84.7% |
| Uruguayans | 93.3 /100 | #113 | Exceptional 84.7% |
| Chileans | 93.2 /100 | #114 | Exceptional 84.7% |
| Bahamians | 93.2 /100 | #115 | Exceptional 84.7% |
| Immigrants | Egypt | 92.7 /100 | #116 | Exceptional 84.7% |
| Immigrants | China | 92.3 /100 | #117 | Exceptional 84.7% |
| Immigrants | Eastern Asia | 92.1 /100 | #118 | Exceptional 84.7% |
| Burmese | 91.8 /100 | #119 | Exceptional 84.7% |
| Immigrants | Northern Europe | 91.5 /100 | #120 | Exceptional 84.7% |
| Finns | 91.2 /100 | #121 | Exceptional 84.7% |
| Germans | 91.0 /100 | #122 | Exceptional 84.7% |
| Immigrants | South America | 90.9 /100 | #123 | Exceptional 84.7% |
| Slavs | 90.8 /100 | #124 | Exceptional 84.7% |
| Maltese | 90.8 /100 | #125 | Exceptional 84.7% |
| Asians | 90.6 /100 | #126 | Exceptional 84.7% |
| Immigrants | Spain | 90.6 /100 | #127 | Exceptional 84.7% |
| Immigrants | Ghana | 90.4 /100 | #128 | Exceptional 84.7% |
| Palestinians | 89.7 /100 | #129 | Excellent 84.7% |
| Bhutanese | 89.7 /100 | #130 | Excellent 84.7% |
| Immigrants | Scotland | 89.6 /100 | #131 | Excellent 84.7% |
| Austrians | 89.4 /100 | #132 | Excellent 84.7% |