Immigrants from Hong Kong vs Dutch West Indian In Labor Force | Age 35-44
COMPARE
Immigrants from Hong Kong
Dutch West Indian
In Labor Force | Age 35-44
In Labor Force | Age 35-44 Comparison
Immigrants from Hong Kong
Dutch West Indians
85.2%
IN LABOR FORCE | AGE 35-44
99.8/ 100
METRIC RATING
46th/ 347
METRIC RANK
80.4%
IN LABOR FORCE | AGE 35-44
0.0/ 100
METRIC RATING
325th/ 347
METRIC RANK
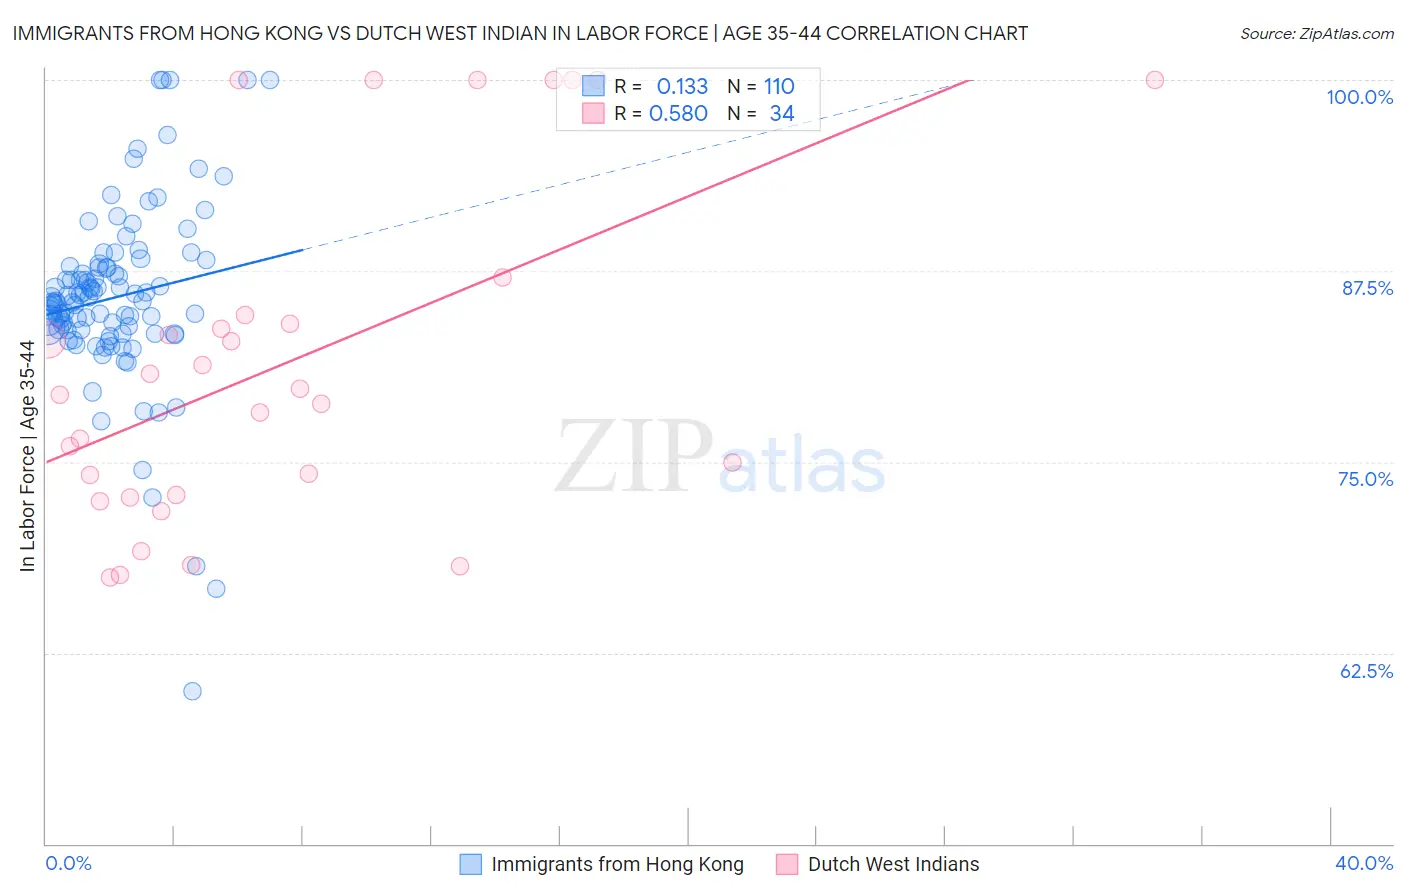
Immigrants from Hong Kong vs Dutch West Indian In Labor Force | Age 35-44 Correlation Chart
The statistical analysis conducted on geographies consisting of 253,913,732 people shows a poor positive correlation between the proportion of Immigrants from Hong Kong and labor force participation rate among population between the ages 35 and 44 in the United States with a correlation coefficient (R) of 0.133 and weighted average of 85.2%. Similarly, the statistical analysis conducted on geographies consisting of 85,765,297 people shows a substantial positive correlation between the proportion of Dutch West Indians and labor force participation rate among population between the ages 35 and 44 in the United States with a correlation coefficient (R) of 0.580 and weighted average of 80.4%, a difference of 5.9%.
In Labor Force | Age 35-44 Correlation Summary
| Measurement | Immigrants from Hong Kong | Dutch West Indian |
| Minimum | 60.0% | 67.4% |
| Maximum | 100.0% | 100.0% |
| Range | 40.0% | 32.6% |
| Mean | 85.8% | 81.6% |
| Median | 85.5% | 79.6% |
| Interquartile 25% (IQ1) | 83.6% | 72.8% |
| Interquartile 75% (IQ3) | 87.7% | 84.6% |
| Interquartile Range (IQR) | 4.1% | 11.8% |
| Standard Deviation (Sample) | 6.0% | 10.9% |
| Standard Deviation (Population) | 6.0% | 10.7% |
Similar Demographics by In Labor Force | Age 35-44
Demographics Similar to Immigrants from Hong Kong by In Labor Force | Age 35-44
In terms of in labor force | age 35-44, the demographic groups most similar to Immigrants from Hong Kong are Cypriot (85.2%, a difference of 0.0%), German Russian (85.2%, a difference of 0.010%), Polish (85.2%, a difference of 0.020%), Lithuanian (85.2%, a difference of 0.020%), and Immigrants from Eritrea (85.2%, a difference of 0.020%).
| Demographics | Rating | Rank | In Labor Force | Age 35-44 |
| Eastern Europeans | 99.8 /100 | #39 | Exceptional 85.2% |
| Immigrants | Bulgaria | 99.8 /100 | #40 | Exceptional 85.2% |
| Immigrants | Zimbabwe | 99.8 /100 | #41 | Exceptional 85.2% |
| Macedonians | 99.8 /100 | #42 | Exceptional 85.2% |
| Poles | 99.8 /100 | #43 | Exceptional 85.2% |
| Lithuanians | 99.8 /100 | #44 | Exceptional 85.2% |
| Cypriots | 99.8 /100 | #45 | Exceptional 85.2% |
| Immigrants | Hong Kong | 99.8 /100 | #46 | Exceptional 85.2% |
| German Russians | 99.8 /100 | #47 | Exceptional 85.2% |
| Immigrants | Eritrea | 99.7 /100 | #48 | Exceptional 85.2% |
| Croatians | 99.7 /100 | #49 | Exceptional 85.2% |
| Thais | 99.7 /100 | #50 | Exceptional 85.2% |
| Immigrants | Albania | 99.7 /100 | #51 | Exceptional 85.1% |
| Immigrants | Kenya | 99.6 /100 | #52 | Exceptional 85.1% |
| Taiwanese | 99.6 /100 | #53 | Exceptional 85.1% |
Demographics Similar to Dutch West Indians by In Labor Force | Age 35-44
In terms of in labor force | age 35-44, the demographic groups most similar to Dutch West Indians are Seminole (80.4%, a difference of 0.040%), Choctaw (80.5%, a difference of 0.15%), Yaqui (80.5%, a difference of 0.16%), Sioux (80.2%, a difference of 0.21%), and Paiute (80.6%, a difference of 0.27%).
| Demographics | Rating | Rank | In Labor Force | Age 35-44 |
| Alaskan Athabascans | 0.0 /100 | #318 | Tragic 81.3% |
| Inupiat | 0.0 /100 | #319 | Tragic 80.9% |
| Chickasaw | 0.0 /100 | #320 | Tragic 80.9% |
| Puerto Ricans | 0.0 /100 | #321 | Tragic 80.7% |
| Paiute | 0.0 /100 | #322 | Tragic 80.6% |
| Yaqui | 0.0 /100 | #323 | Tragic 80.5% |
| Choctaw | 0.0 /100 | #324 | Tragic 80.5% |
| Dutch West Indians | 0.0 /100 | #325 | Tragic 80.4% |
| Seminole | 0.0 /100 | #326 | Tragic 80.4% |
| Sioux | 0.0 /100 | #327 | Tragic 80.2% |
| Creek | 0.0 /100 | #328 | Tragic 80.0% |
| Menominee | 0.0 /100 | #329 | Tragic 79.7% |
| Cheyenne | 0.0 /100 | #330 | Tragic 79.5% |
| Houma | 0.0 /100 | #331 | Tragic 79.5% |
| Ute | 0.0 /100 | #332 | Tragic 79.4% |