Palestinian vs Dutch West Indian In Labor Force | Age 25-29
COMPARE
Palestinian
Dutch West Indian
In Labor Force | Age 25-29
In Labor Force | Age 25-29 Comparison
Palestinians
Dutch West Indians
84.7%
IN LABOR FORCE | AGE 25-29
50.0/ 100
METRIC RATING
174th/ 347
METRIC RANK
81.1%
IN LABOR FORCE | AGE 25-29
0.0/ 100
METRIC RATING
325th/ 347
METRIC RANK
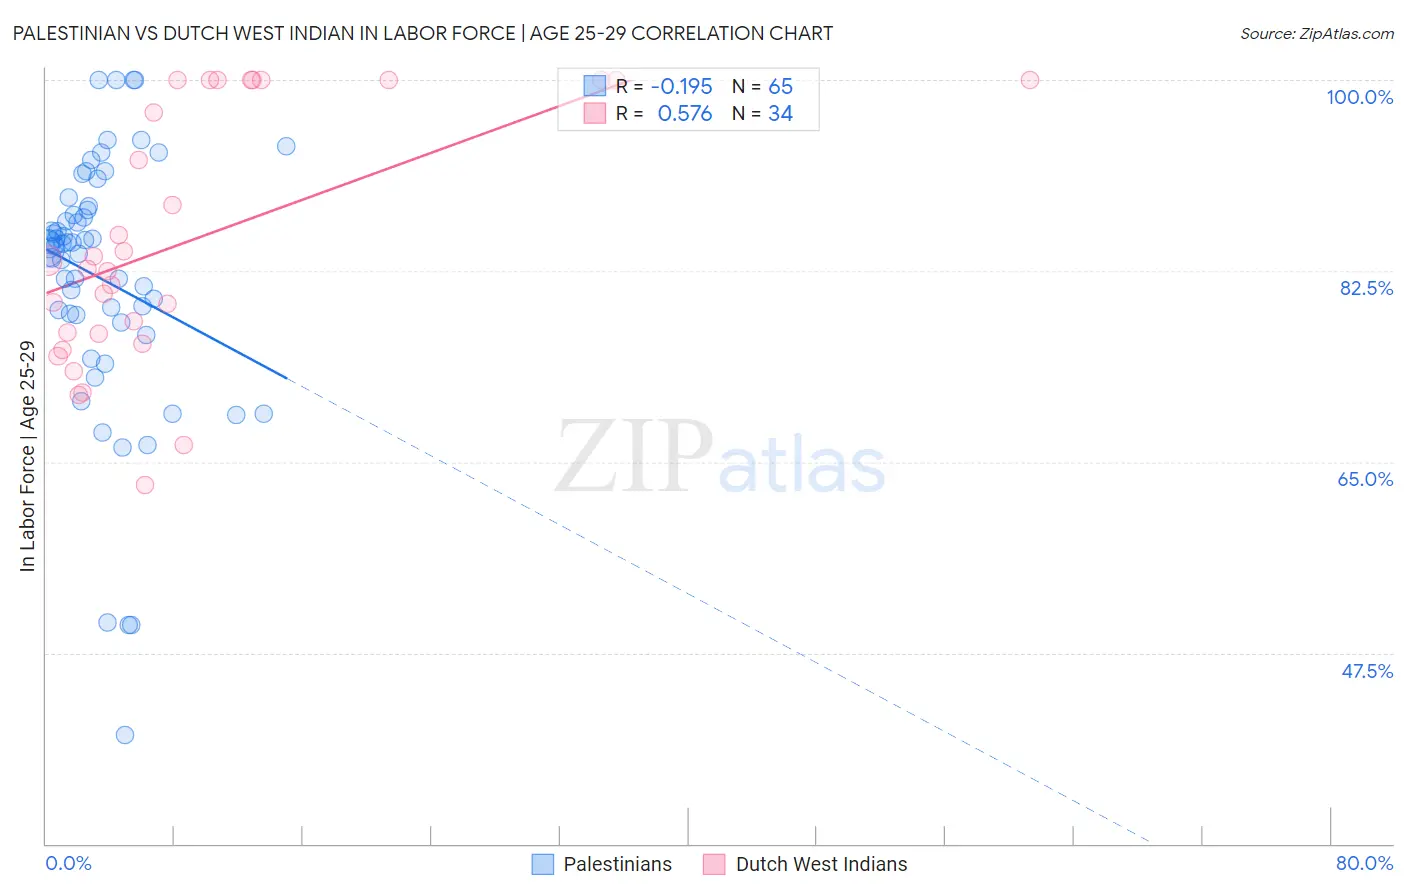
Palestinian vs Dutch West Indian In Labor Force | Age 25-29 Correlation Chart
The statistical analysis conducted on geographies consisting of 216,447,152 people shows a poor negative correlation between the proportion of Palestinians and labor force participation rate among population between the ages 25 and 29 in the United States with a correlation coefficient (R) of -0.195 and weighted average of 84.7%. Similarly, the statistical analysis conducted on geographies consisting of 85,749,797 people shows a substantial positive correlation between the proportion of Dutch West Indians and labor force participation rate among population between the ages 25 and 29 in the United States with a correlation coefficient (R) of 0.576 and weighted average of 81.1%, a difference of 4.3%.
In Labor Force | Age 25-29 Correlation Summary
| Measurement | Palestinian | Dutch West Indian |
| Minimum | 40.0% | 62.9% |
| Maximum | 100.0% | 100.0% |
| Range | 60.0% | 37.1% |
| Mean | 81.8% | 85.4% |
| Median | 84.8% | 83.1% |
| Interquartile 25% (IQ1) | 78.1% | 76.8% |
| Interquartile 75% (IQ3) | 88.2% | 100.0% |
| Interquartile Range (IQR) | 10.1% | 23.2% |
| Standard Deviation (Sample) | 12.1% | 11.5% |
| Standard Deviation (Population) | 12.0% | 11.4% |
Similar Demographics by In Labor Force | Age 25-29
Demographics Similar to Palestinians by In Labor Force | Age 25-29
In terms of in labor force | age 25-29, the demographic groups most similar to Palestinians are Immigrants from Vietnam (84.7%, a difference of 0.0%), Immigrants from Western Europe (84.7%, a difference of 0.0%), Assyrian/Chaldean/Syriac (84.7%, a difference of 0.0%), Celtic (84.7%, a difference of 0.020%), and Tongan (84.7%, a difference of 0.020%).
| Demographics | Rating | Rank | In Labor Force | Age 25-29 |
| Indonesians | 56.5 /100 | #167 | Average 84.7% |
| South Americans | 54.9 /100 | #168 | Average 84.7% |
| Celtics | 52.5 /100 | #169 | Average 84.7% |
| Tongans | 52.4 /100 | #170 | Average 84.7% |
| Immigrants | Vietnam | 50.5 /100 | #171 | Average 84.7% |
| Immigrants | Western Europe | 50.4 /100 | #172 | Average 84.7% |
| Assyrians/Chaldeans/Syriacs | 50.2 /100 | #173 | Average 84.7% |
| Palestinians | 50.0 /100 | #174 | Average 84.7% |
| Hungarians | 47.8 /100 | #175 | Average 84.6% |
| Malaysians | 46.8 /100 | #176 | Average 84.6% |
| Immigrants | China | 45.7 /100 | #177 | Average 84.6% |
| Immigrants | Thailand | 45.2 /100 | #178 | Average 84.6% |
| Immigrants | Argentina | 44.0 /100 | #179 | Average 84.6% |
| Immigrants | South America | 42.9 /100 | #180 | Average 84.6% |
| Immigrants | Norway | 41.9 /100 | #181 | Average 84.6% |
Demographics Similar to Dutch West Indians by In Labor Force | Age 25-29
In terms of in labor force | age 25-29, the demographic groups most similar to Dutch West Indians are Houma (81.2%, a difference of 0.11%), Choctaw (81.0%, a difference of 0.20%), Ute (80.8%, a difference of 0.41%), Alaska Native (81.6%, a difference of 0.52%), and Creek (80.7%, a difference of 0.55%).
| Demographics | Rating | Rank | In Labor Force | Age 25-29 |
| Comanche | 0.0 /100 | #318 | Tragic 81.9% |
| Seminole | 0.0 /100 | #319 | Tragic 81.7% |
| Colville | 0.0 /100 | #320 | Tragic 81.6% |
| Shoshone | 0.0 /100 | #321 | Tragic 81.6% |
| Kiowa | 0.0 /100 | #322 | Tragic 81.6% |
| Alaska Natives | 0.0 /100 | #323 | Tragic 81.6% |
| Houma | 0.0 /100 | #324 | Tragic 81.2% |
| Dutch West Indians | 0.0 /100 | #325 | Tragic 81.1% |
| Choctaw | 0.0 /100 | #326 | Tragic 81.0% |
| Ute | 0.0 /100 | #327 | Tragic 80.8% |
| Creek | 0.0 /100 | #328 | Tragic 80.7% |
| Yakama | 0.0 /100 | #329 | Tragic 80.6% |
| Puerto Ricans | 0.0 /100 | #330 | Tragic 80.4% |
| Cheyenne | 0.0 /100 | #331 | Tragic 80.3% |
| Inupiat | 0.0 /100 | #332 | Tragic 79.8% |