Pakistani vs British West Indian In Labor Force | Age 25-29
COMPARE
Pakistani
British West Indian
In Labor Force | Age 25-29
In Labor Force | Age 25-29 Comparison
Pakistanis
British West Indians
84.8%
IN LABOR FORCE | AGE 25-29
70.0/ 100
METRIC RATING
142nd/ 347
METRIC RANK
83.2%
IN LABOR FORCE | AGE 25-29
0.0/ 100
METRIC RATING
279th/ 347
METRIC RANK
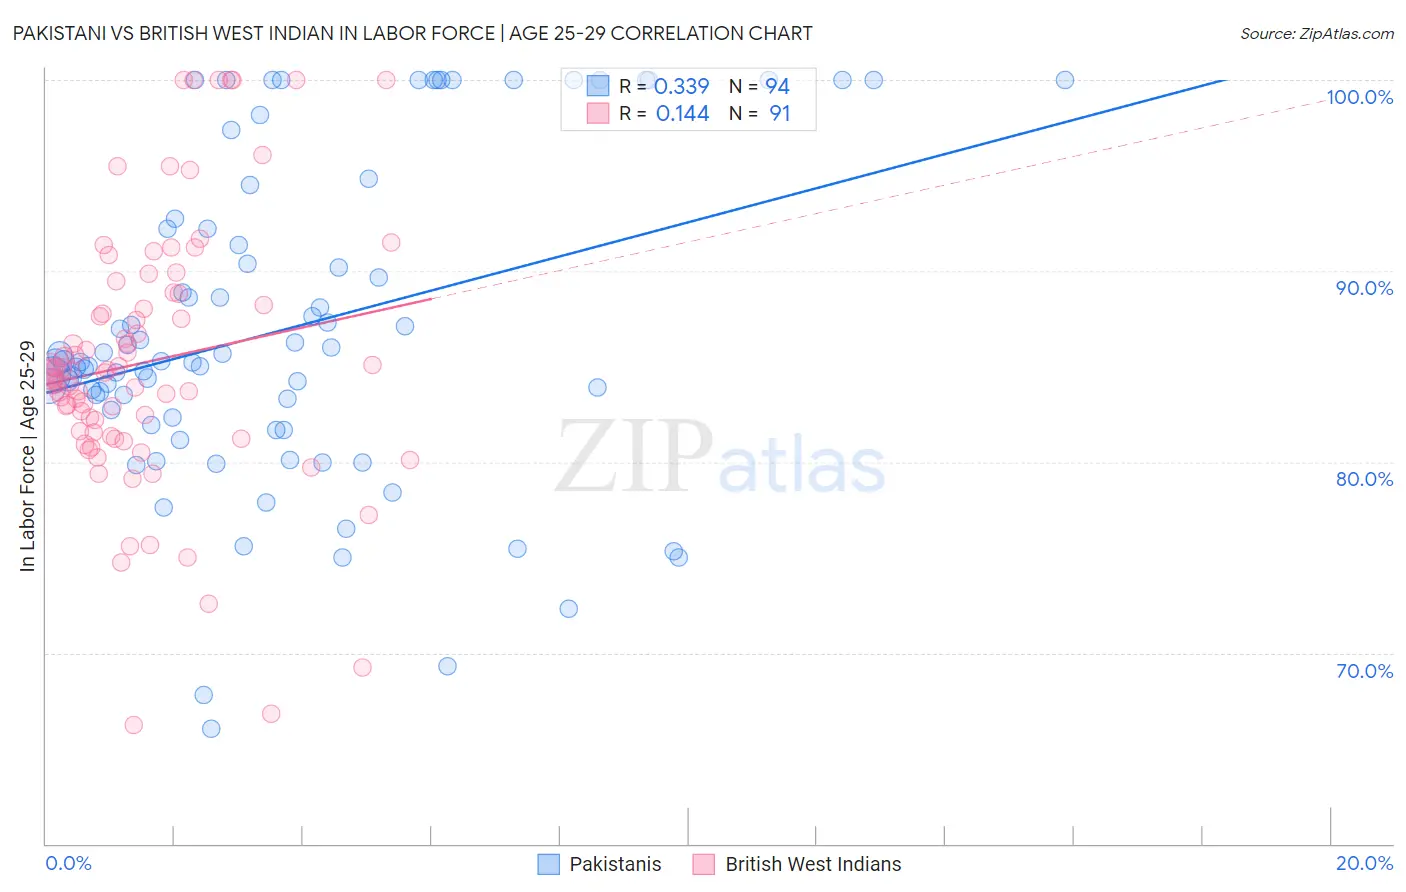
Pakistani vs British West Indian In Labor Force | Age 25-29 Correlation Chart
The statistical analysis conducted on geographies consisting of 335,283,437 people shows a mild positive correlation between the proportion of Pakistanis and labor force participation rate among population between the ages 25 and 29 in the United States with a correlation coefficient (R) of 0.339 and weighted average of 84.8%. Similarly, the statistical analysis conducted on geographies consisting of 152,666,042 people shows a poor positive correlation between the proportion of British West Indians and labor force participation rate among population between the ages 25 and 29 in the United States with a correlation coefficient (R) of 0.144 and weighted average of 83.2%, a difference of 1.9%.
In Labor Force | Age 25-29 Correlation Summary
| Measurement | Pakistani | British West Indian |
| Minimum | 66.0% | 66.2% |
| Maximum | 100.0% | 100.0% |
| Range | 34.0% | 33.8% |
| Mean | 87.0% | 85.2% |
| Median | 85.2% | 84.7% |
| Interquartile 25% (IQ1) | 82.3% | 81.3% |
| Interquartile 75% (IQ3) | 92.2% | 88.8% |
| Interquartile Range (IQR) | 9.9% | 7.5% |
| Standard Deviation (Sample) | 8.4% | 7.0% |
| Standard Deviation (Population) | 8.3% | 6.9% |
Similar Demographics by In Labor Force | Age 25-29
Demographics Similar to Pakistanis by In Labor Force | Age 25-29
In terms of in labor force | age 25-29, the demographic groups most similar to Pakistanis are Sri Lankan (84.8%, a difference of 0.010%), Immigrants from Laos (84.8%, a difference of 0.010%), Immigrants from Senegal (84.8%, a difference of 0.010%), Armenian (84.8%, a difference of 0.020%), and Immigrants from Eastern Asia (84.8%, a difference of 0.020%).
| Demographics | Rating | Rank | In Labor Force | Age 25-29 |
| Immigrants | Hungary | 76.4 /100 | #135 | Good 84.8% |
| Bhutanese | 76.0 /100 | #136 | Good 84.8% |
| Immigrants | Canada | 73.5 /100 | #137 | Good 84.8% |
| Armenians | 72.7 /100 | #138 | Good 84.8% |
| Immigrants | Eastern Asia | 72.6 /100 | #139 | Good 84.8% |
| Immigrants | North America | 72.1 /100 | #140 | Good 84.8% |
| Danes | 71.9 /100 | #141 | Good 84.8% |
| Pakistanis | 70.0 /100 | #142 | Good 84.8% |
| Sri Lankans | 69.2 /100 | #143 | Good 84.8% |
| Immigrants | Laos | 69.0 /100 | #144 | Good 84.8% |
| Immigrants | Senegal | 68.3 /100 | #145 | Good 84.8% |
| Icelanders | 68.2 /100 | #146 | Good 84.8% |
| Immigrants | Asia | 68.2 /100 | #147 | Good 84.8% |
| Immigrants | England | 65.2 /100 | #148 | Good 84.7% |
| Peruvians | 64.7 /100 | #149 | Good 84.7% |
Demographics Similar to British West Indians by In Labor Force | Age 25-29
In terms of in labor force | age 25-29, the demographic groups most similar to British West Indians are Immigrants from Cuba (83.2%, a difference of 0.010%), Dominican (83.2%, a difference of 0.020%), African (83.2%, a difference of 0.060%), Immigrants from Dominican Republic (83.1%, a difference of 0.080%), and American (83.1%, a difference of 0.090%).
| Demographics | Rating | Rank | In Labor Force | Age 25-29 |
| Immigrants | Caribbean | 0.0 /100 | #272 | Tragic 83.4% |
| Immigrants | Dominica | 0.0 /100 | #273 | Tragic 83.4% |
| Marshallese | 0.0 /100 | #274 | Tragic 83.3% |
| Samoans | 0.0 /100 | #275 | Tragic 83.3% |
| Immigrants | Honduras | 0.0 /100 | #276 | Tragic 83.3% |
| Africans | 0.0 /100 | #277 | Tragic 83.2% |
| Immigrants | Cuba | 0.0 /100 | #278 | Tragic 83.2% |
| British West Indians | 0.0 /100 | #279 | Tragic 83.2% |
| Dominicans | 0.0 /100 | #280 | Tragic 83.2% |
| Immigrants | Dominican Republic | 0.0 /100 | #281 | Tragic 83.1% |
| Americans | 0.0 /100 | #282 | Tragic 83.1% |
| Immigrants | Azores | 0.0 /100 | #283 | Tragic 83.1% |
| Nicaraguans | 0.0 /100 | #284 | Tragic 83.1% |
| Belizeans | 0.0 /100 | #285 | Tragic 83.1% |
| Mexican American Indians | 0.0 /100 | #286 | Tragic 83.0% |