Pakistani vs Puget Sound Salish In Labor Force | Age 25-29
COMPARE
Pakistani
Puget Sound Salish
In Labor Force | Age 25-29
In Labor Force | Age 25-29 Comparison
Pakistanis
Puget Sound Salish
84.8%
IN LABOR FORCE | AGE 25-29
70.0/ 100
METRIC RATING
142nd/ 347
METRIC RANK
83.5%
IN LABOR FORCE | AGE 25-29
0.1/ 100
METRIC RATING
264th/ 347
METRIC RANK
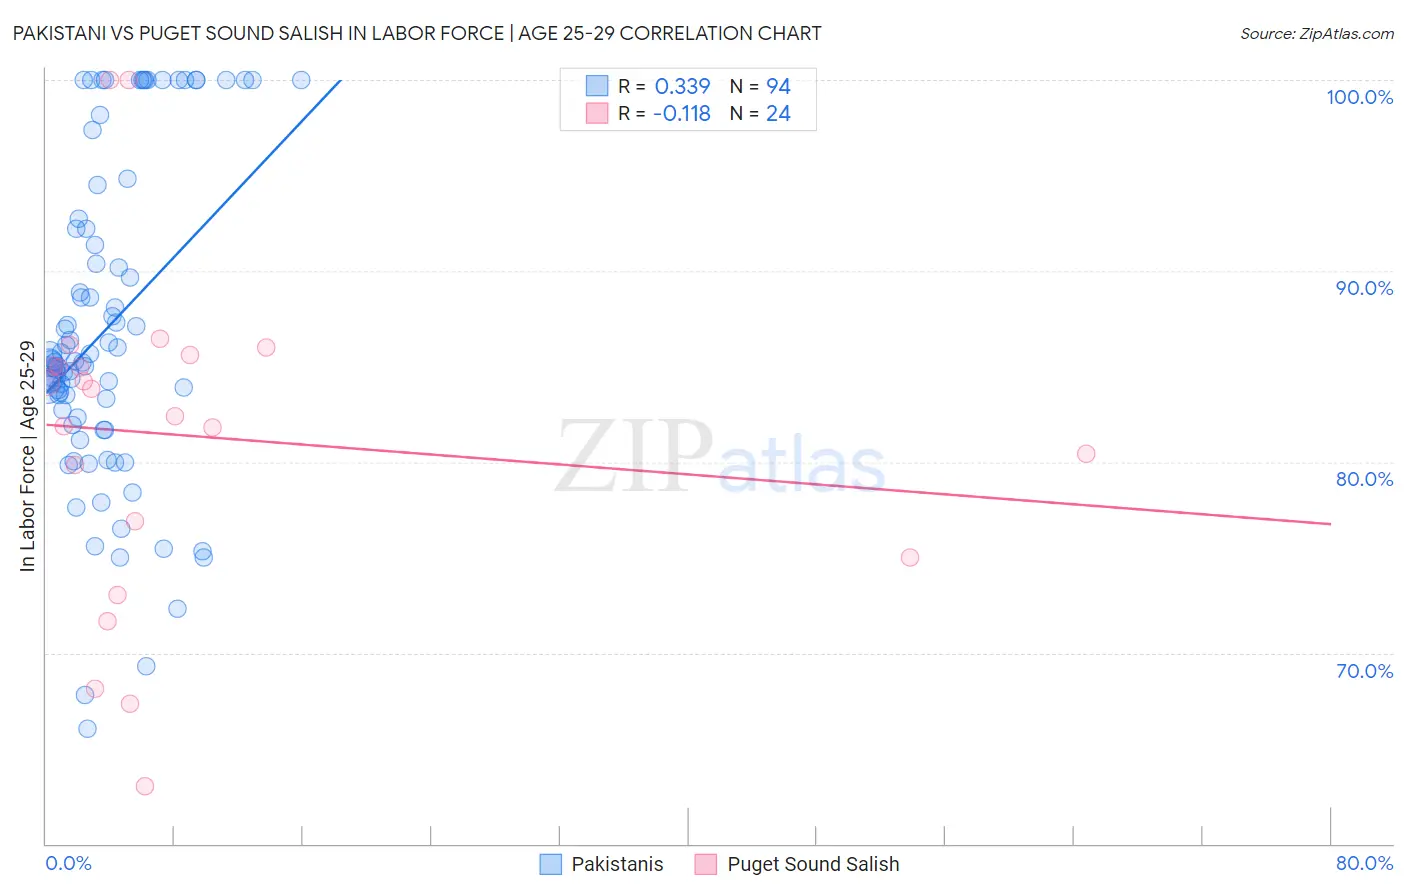
Pakistani vs Puget Sound Salish In Labor Force | Age 25-29 Correlation Chart
The statistical analysis conducted on geographies consisting of 335,283,437 people shows a mild positive correlation between the proportion of Pakistanis and labor force participation rate among population between the ages 25 and 29 in the United States with a correlation coefficient (R) of 0.339 and weighted average of 84.8%. Similarly, the statistical analysis conducted on geographies consisting of 46,150,488 people shows a poor negative correlation between the proportion of Puget Sound Salish and labor force participation rate among population between the ages 25 and 29 in the United States with a correlation coefficient (R) of -0.118 and weighted average of 83.5%, a difference of 1.6%.
In Labor Force | Age 25-29 Correlation Summary
| Measurement | Pakistani | Puget Sound Salish |
| Minimum | 66.0% | 63.0% |
| Maximum | 100.0% | 100.0% |
| Range | 34.0% | 37.0% |
| Mean | 87.0% | 81.4% |
| Median | 85.2% | 83.1% |
| Interquartile 25% (IQ1) | 82.3% | 76.0% |
| Interquartile 75% (IQ3) | 92.2% | 85.3% |
| Interquartile Range (IQR) | 9.9% | 9.4% |
| Standard Deviation (Sample) | 8.4% | 8.8% |
| Standard Deviation (Population) | 8.3% | 8.6% |
Similar Demographics by In Labor Force | Age 25-29
Demographics Similar to Pakistanis by In Labor Force | Age 25-29
In terms of in labor force | age 25-29, the demographic groups most similar to Pakistanis are Sri Lankan (84.8%, a difference of 0.010%), Immigrants from Laos (84.8%, a difference of 0.010%), Immigrants from Senegal (84.8%, a difference of 0.010%), Armenian (84.8%, a difference of 0.020%), and Immigrants from Eastern Asia (84.8%, a difference of 0.020%).
| Demographics | Rating | Rank | In Labor Force | Age 25-29 |
| Immigrants | Hungary | 76.4 /100 | #135 | Good 84.8% |
| Bhutanese | 76.0 /100 | #136 | Good 84.8% |
| Immigrants | Canada | 73.5 /100 | #137 | Good 84.8% |
| Armenians | 72.7 /100 | #138 | Good 84.8% |
| Immigrants | Eastern Asia | 72.6 /100 | #139 | Good 84.8% |
| Immigrants | North America | 72.1 /100 | #140 | Good 84.8% |
| Danes | 71.9 /100 | #141 | Good 84.8% |
| Pakistanis | 70.0 /100 | #142 | Good 84.8% |
| Sri Lankans | 69.2 /100 | #143 | Good 84.8% |
| Immigrants | Laos | 69.0 /100 | #144 | Good 84.8% |
| Immigrants | Senegal | 68.3 /100 | #145 | Good 84.8% |
| Icelanders | 68.2 /100 | #146 | Good 84.8% |
| Immigrants | Asia | 68.2 /100 | #147 | Good 84.8% |
| Immigrants | England | 65.2 /100 | #148 | Good 84.7% |
| Peruvians | 64.7 /100 | #149 | Good 84.7% |
Demographics Similar to Puget Sound Salish by In Labor Force | Age 25-29
In terms of in labor force | age 25-29, the demographic groups most similar to Puget Sound Salish are Cuban (83.5%, a difference of 0.0%), Aleut (83.4%, a difference of 0.040%), Spanish American (83.4%, a difference of 0.050%), West Indian (83.5%, a difference of 0.060%), and Immigrants from Lebanon (83.4%, a difference of 0.060%).
| Demographics | Rating | Rank | In Labor Force | Age 25-29 |
| Delaware | 0.2 /100 | #257 | Tragic 83.7% |
| Immigrants | Guatemala | 0.1 /100 | #258 | Tragic 83.6% |
| Spanish | 0.1 /100 | #259 | Tragic 83.6% |
| Immigrants | Bahamas | 0.1 /100 | #260 | Tragic 83.6% |
| Pennsylvania Germans | 0.1 /100 | #261 | Tragic 83.6% |
| Immigrants | Fiji | 0.1 /100 | #262 | Tragic 83.6% |
| West Indians | 0.1 /100 | #263 | Tragic 83.5% |
| Puget Sound Salish | 0.1 /100 | #264 | Tragic 83.5% |
| Cubans | 0.1 /100 | #265 | Tragic 83.5% |
| Aleuts | 0.0 /100 | #266 | Tragic 83.4% |
| Spanish Americans | 0.0 /100 | #267 | Tragic 83.4% |
| Immigrants | Lebanon | 0.0 /100 | #268 | Tragic 83.4% |
| Immigrants | Barbados | 0.0 /100 | #269 | Tragic 83.4% |
| Basques | 0.0 /100 | #270 | Tragic 83.4% |
| Hondurans | 0.0 /100 | #271 | Tragic 83.4% |