Spanish American vs British West Indian In Labor Force | Age 25-29
COMPARE
Spanish American
British West Indian
In Labor Force | Age 25-29
In Labor Force | Age 25-29 Comparison
Spanish Americans
British West Indians
83.4%
IN LABOR FORCE | AGE 25-29
0.0/ 100
METRIC RATING
267th/ 347
METRIC RANK
83.2%
IN LABOR FORCE | AGE 25-29
0.0/ 100
METRIC RATING
279th/ 347
METRIC RANK
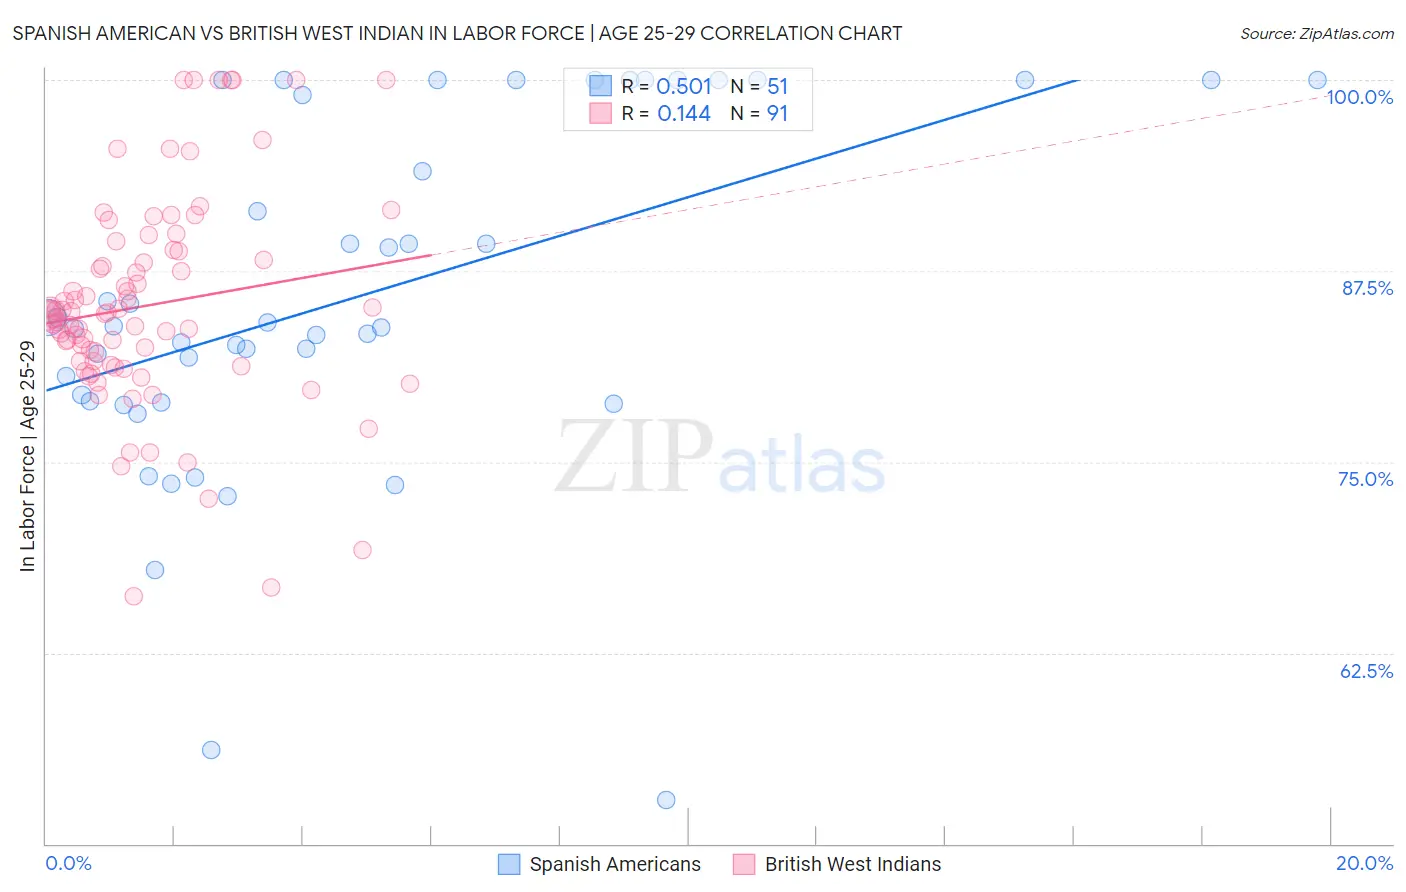
Spanish American vs British West Indian In Labor Force | Age 25-29 Correlation Chart
The statistical analysis conducted on geographies consisting of 103,156,103 people shows a substantial positive correlation between the proportion of Spanish Americans and labor force participation rate among population between the ages 25 and 29 in the United States with a correlation coefficient (R) of 0.501 and weighted average of 83.4%. Similarly, the statistical analysis conducted on geographies consisting of 152,666,042 people shows a poor positive correlation between the proportion of British West Indians and labor force participation rate among population between the ages 25 and 29 in the United States with a correlation coefficient (R) of 0.144 and weighted average of 83.2%, a difference of 0.29%.
In Labor Force | Age 25-29 Correlation Summary
| Measurement | Spanish American | British West Indian |
| Minimum | 52.9% | 66.2% |
| Maximum | 100.0% | 100.0% |
| Range | 47.1% | 33.8% |
| Mean | 85.8% | 85.2% |
| Median | 83.9% | 84.7% |
| Interquartile 25% (IQ1) | 79.0% | 81.3% |
| Interquartile 75% (IQ3) | 100.0% | 88.8% |
| Interquartile Range (IQR) | 21.0% | 7.5% |
| Standard Deviation (Sample) | 11.3% | 7.0% |
| Standard Deviation (Population) | 11.2% | 6.9% |
Demographics Similar to Spanish Americans and British West Indians by In Labor Force | Age 25-29
In terms of in labor force | age 25-29, the demographic groups most similar to Spanish Americans are Aleut (83.4%, a difference of 0.010%), Immigrants from Lebanon (83.4%, a difference of 0.010%), Immigrants from Barbados (83.4%, a difference of 0.010%), Basque (83.4%, a difference of 0.020%), and Puget Sound Salish (83.5%, a difference of 0.050%). Similarly, the demographic groups most similar to British West Indians are Immigrants from Cuba (83.2%, a difference of 0.010%), Dominican (83.2%, a difference of 0.020%), African (83.2%, a difference of 0.060%), Immigrants from Dominican Republic (83.1%, a difference of 0.080%), and American (83.1%, a difference of 0.090%).
| Demographics | Rating | Rank | In Labor Force | Age 25-29 |
| West Indians | 0.1 /100 | #263 | Tragic 83.5% |
| Puget Sound Salish | 0.1 /100 | #264 | Tragic 83.5% |
| Cubans | 0.1 /100 | #265 | Tragic 83.5% |
| Aleuts | 0.0 /100 | #266 | Tragic 83.4% |
| Spanish Americans | 0.0 /100 | #267 | Tragic 83.4% |
| Immigrants | Lebanon | 0.0 /100 | #268 | Tragic 83.4% |
| Immigrants | Barbados | 0.0 /100 | #269 | Tragic 83.4% |
| Basques | 0.0 /100 | #270 | Tragic 83.4% |
| Hondurans | 0.0 /100 | #271 | Tragic 83.4% |
| Immigrants | Caribbean | 0.0 /100 | #272 | Tragic 83.4% |
| Immigrants | Dominica | 0.0 /100 | #273 | Tragic 83.4% |
| Marshallese | 0.0 /100 | #274 | Tragic 83.3% |
| Samoans | 0.0 /100 | #275 | Tragic 83.3% |
| Immigrants | Honduras | 0.0 /100 | #276 | Tragic 83.3% |
| Africans | 0.0 /100 | #277 | Tragic 83.2% |
| Immigrants | Cuba | 0.0 /100 | #278 | Tragic 83.2% |
| British West Indians | 0.0 /100 | #279 | Tragic 83.2% |
| Dominicans | 0.0 /100 | #280 | Tragic 83.2% |
| Immigrants | Dominican Republic | 0.0 /100 | #281 | Tragic 83.1% |
| Americans | 0.0 /100 | #282 | Tragic 83.1% |
| Immigrants | Azores | 0.0 /100 | #283 | Tragic 83.1% |