Immigrants from Peru vs British West Indian In Labor Force | Age 25-29
COMPARE
Immigrants from Peru
British West Indian
In Labor Force | Age 25-29
In Labor Force | Age 25-29 Comparison
Immigrants from Peru
British West Indians
84.7%
IN LABOR FORCE | AGE 25-29
58.6/ 100
METRIC RATING
160th/ 347
METRIC RANK
83.2%
IN LABOR FORCE | AGE 25-29
0.0/ 100
METRIC RATING
279th/ 347
METRIC RANK
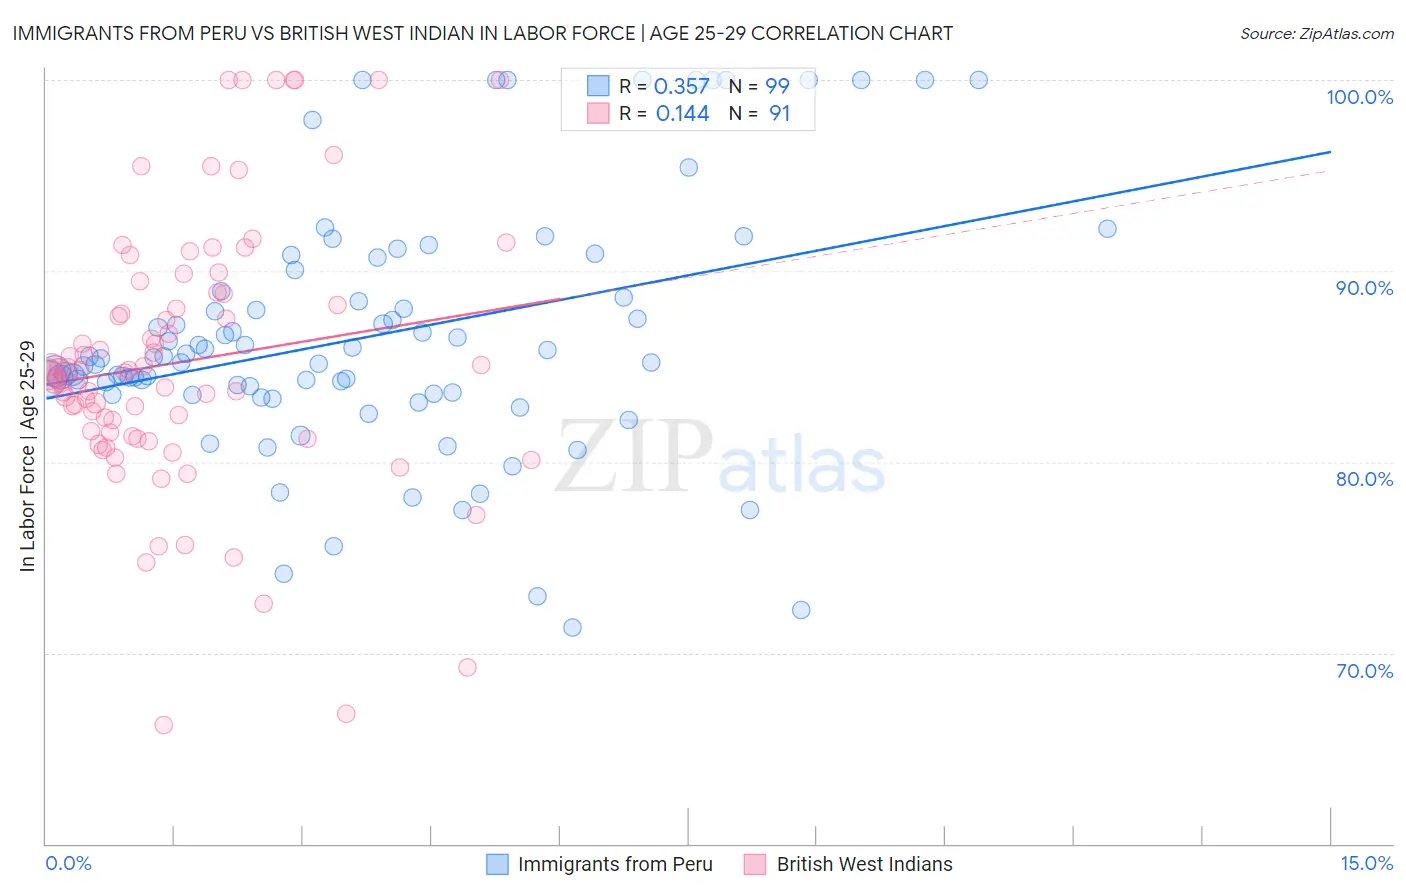
Immigrants from Peru vs British West Indian In Labor Force | Age 25-29 Correlation Chart
The statistical analysis conducted on geographies consisting of 328,804,667 people shows a mild positive correlation between the proportion of Immigrants from Peru and labor force participation rate among population between the ages 25 and 29 in the United States with a correlation coefficient (R) of 0.357 and weighted average of 84.7%. Similarly, the statistical analysis conducted on geographies consisting of 152,666,042 people shows a poor positive correlation between the proportion of British West Indians and labor force participation rate among population between the ages 25 and 29 in the United States with a correlation coefficient (R) of 0.144 and weighted average of 83.2%, a difference of 1.8%.
In Labor Force | Age 25-29 Correlation Summary
| Measurement | Immigrants from Peru | British West Indian |
| Minimum | 71.3% | 66.2% |
| Maximum | 100.0% | 100.0% |
| Range | 28.7% | 33.8% |
| Mean | 86.6% | 85.2% |
| Median | 85.4% | 84.7% |
| Interquartile 25% (IQ1) | 83.5% | 81.3% |
| Interquartile 75% (IQ3) | 88.9% | 88.8% |
| Interquartile Range (IQR) | 5.4% | 7.5% |
| Standard Deviation (Sample) | 6.5% | 7.0% |
| Standard Deviation (Population) | 6.5% | 6.9% |
Similar Demographics by In Labor Force | Age 25-29
Demographics Similar to Immigrants from Peru by In Labor Force | Age 25-29
In terms of in labor force | age 25-29, the demographic groups most similar to Immigrants from Peru are Canadian (84.7%, a difference of 0.0%), Immigrants from Colombia (84.7%, a difference of 0.0%), British (84.7%, a difference of 0.010%), Immigrants from Ghana (84.7%, a difference of 0.010%), and Immigrants from Western Africa (84.7%, a difference of 0.010%).
| Demographics | Rating | Rank | In Labor Force | Age 25-29 |
| Immigrants | Taiwan | 62.2 /100 | #153 | Good 84.7% |
| Immigrants | Sri Lanka | 61.7 /100 | #154 | Good 84.7% |
| Indians (Asian) | 61.6 /100 | #155 | Good 84.7% |
| French | 61.0 /100 | #156 | Good 84.7% |
| British | 60.4 /100 | #157 | Good 84.7% |
| Immigrants | Ghana | 60.2 /100 | #158 | Good 84.7% |
| Immigrants | Western Africa | 60.1 /100 | #159 | Good 84.7% |
| Immigrants | Peru | 58.6 /100 | #160 | Average 84.7% |
| Canadians | 58.5 /100 | #161 | Average 84.7% |
| Immigrants | Colombia | 58.3 /100 | #162 | Average 84.7% |
| Argentineans | 57.9 /100 | #163 | Average 84.7% |
| Ghanaians | 57.6 /100 | #164 | Average 84.7% |
| Immigrants | Burma/Myanmar | 57.4 /100 | #165 | Average 84.7% |
| Immigrants | Spain | 56.9 /100 | #166 | Average 84.7% |
| Indonesians | 56.5 /100 | #167 | Average 84.7% |
Demographics Similar to British West Indians by In Labor Force | Age 25-29
In terms of in labor force | age 25-29, the demographic groups most similar to British West Indians are Immigrants from Cuba (83.2%, a difference of 0.010%), Dominican (83.2%, a difference of 0.020%), African (83.2%, a difference of 0.060%), Immigrants from Dominican Republic (83.1%, a difference of 0.080%), and American (83.1%, a difference of 0.090%).
| Demographics | Rating | Rank | In Labor Force | Age 25-29 |
| Immigrants | Caribbean | 0.0 /100 | #272 | Tragic 83.4% |
| Immigrants | Dominica | 0.0 /100 | #273 | Tragic 83.4% |
| Marshallese | 0.0 /100 | #274 | Tragic 83.3% |
| Samoans | 0.0 /100 | #275 | Tragic 83.3% |
| Immigrants | Honduras | 0.0 /100 | #276 | Tragic 83.3% |
| Africans | 0.0 /100 | #277 | Tragic 83.2% |
| Immigrants | Cuba | 0.0 /100 | #278 | Tragic 83.2% |
| British West Indians | 0.0 /100 | #279 | Tragic 83.2% |
| Dominicans | 0.0 /100 | #280 | Tragic 83.2% |
| Immigrants | Dominican Republic | 0.0 /100 | #281 | Tragic 83.1% |
| Americans | 0.0 /100 | #282 | Tragic 83.1% |
| Immigrants | Azores | 0.0 /100 | #283 | Tragic 83.1% |
| Nicaraguans | 0.0 /100 | #284 | Tragic 83.1% |
| Belizeans | 0.0 /100 | #285 | Tragic 83.1% |
| Mexican American Indians | 0.0 /100 | #286 | Tragic 83.0% |