Immigrants from Belize vs British West Indian In Labor Force | Age 25-29
COMPARE
Immigrants from Belize
British West Indian
In Labor Force | Age 25-29
In Labor Force | Age 25-29 Comparison
Immigrants from Belize
British West Indians
82.8%
IN LABOR FORCE | AGE 25-29
0.0/ 100
METRIC RATING
302nd/ 347
METRIC RANK
83.2%
IN LABOR FORCE | AGE 25-29
0.0/ 100
METRIC RATING
279th/ 347
METRIC RANK
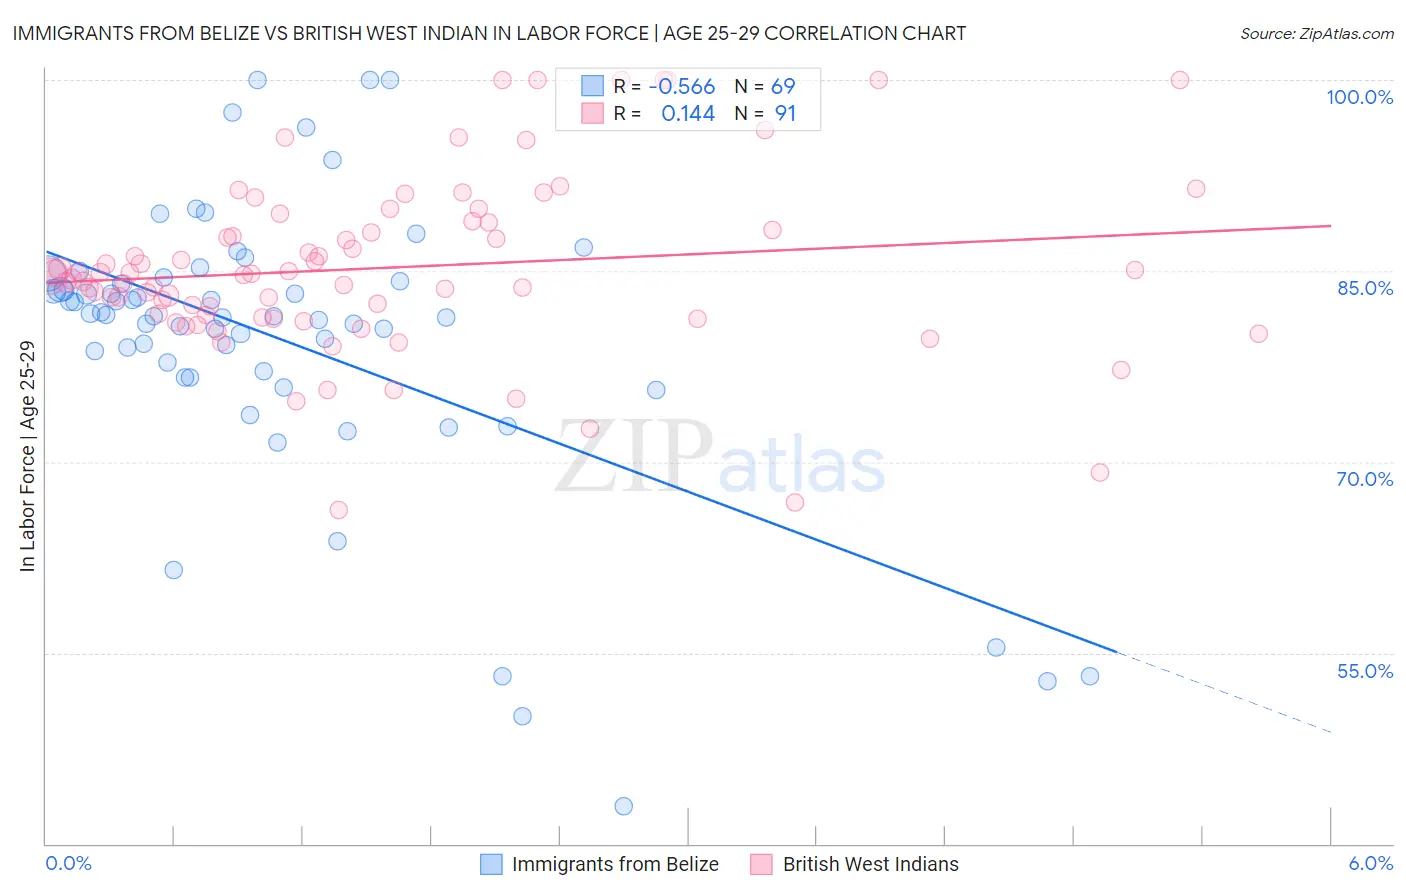
Immigrants from Belize vs British West Indian In Labor Force | Age 25-29 Correlation Chart
The statistical analysis conducted on geographies consisting of 130,310,210 people shows a substantial negative correlation between the proportion of Immigrants from Belize and labor force participation rate among population between the ages 25 and 29 in the United States with a correlation coefficient (R) of -0.566 and weighted average of 82.8%. Similarly, the statistical analysis conducted on geographies consisting of 152,666,042 people shows a poor positive correlation between the proportion of British West Indians and labor force participation rate among population between the ages 25 and 29 in the United States with a correlation coefficient (R) of 0.144 and weighted average of 83.2%, a difference of 0.45%.
In Labor Force | Age 25-29 Correlation Summary
| Measurement | Immigrants from Belize | British West Indian |
| Minimum | 42.9% | 66.2% |
| Maximum | 100.0% | 100.0% |
| Range | 57.1% | 33.8% |
| Mean | 79.6% | 85.2% |
| Median | 81.5% | 84.7% |
| Interquartile 25% (IQ1) | 76.9% | 81.3% |
| Interquartile 75% (IQ3) | 84.3% | 88.8% |
| Interquartile Range (IQR) | 7.5% | 7.5% |
| Standard Deviation (Sample) | 11.3% | 7.0% |
| Standard Deviation (Population) | 11.2% | 6.9% |
Similar Demographics by In Labor Force | Age 25-29
Demographics Similar to Immigrants from Belize by In Labor Force | Age 25-29
In terms of in labor force | age 25-29, the demographic groups most similar to Immigrants from Belize are Immigrants from Grenada (82.8%, a difference of 0.010%), Vietnamese (82.8%, a difference of 0.030%), Spanish American Indian (82.9%, a difference of 0.10%), Fijian (82.9%, a difference of 0.11%), and Native Hawaiian (82.9%, a difference of 0.12%).
| Demographics | Rating | Rank | In Labor Force | Age 25-29 |
| Chippewa | 0.0 /100 | #295 | Tragic 82.9% |
| Immigrants | Nicaragua | 0.0 /100 | #296 | Tragic 82.9% |
| Potawatomi | 0.0 /100 | #297 | Tragic 82.9% |
| Native Hawaiians | 0.0 /100 | #298 | Tragic 82.9% |
| Fijians | 0.0 /100 | #299 | Tragic 82.9% |
| Spanish American Indians | 0.0 /100 | #300 | Tragic 82.9% |
| Vietnamese | 0.0 /100 | #301 | Tragic 82.8% |
| Immigrants | Belize | 0.0 /100 | #302 | Tragic 82.8% |
| Immigrants | Grenada | 0.0 /100 | #303 | Tragic 82.8% |
| Immigrants | St. Vincent and the Grenadines | 0.0 /100 | #304 | Tragic 82.7% |
| Blacks/African Americans | 0.0 /100 | #305 | Tragic 82.6% |
| Blackfeet | 0.0 /100 | #306 | Tragic 82.6% |
| Cajuns | 0.0 /100 | #307 | Tragic 82.5% |
| Central American Indians | 0.0 /100 | #308 | Tragic 82.4% |
| Immigrants | Central America | 0.0 /100 | #309 | Tragic 82.4% |
Demographics Similar to British West Indians by In Labor Force | Age 25-29
In terms of in labor force | age 25-29, the demographic groups most similar to British West Indians are Immigrants from Cuba (83.2%, a difference of 0.010%), Dominican (83.2%, a difference of 0.020%), African (83.2%, a difference of 0.060%), Immigrants from Dominican Republic (83.1%, a difference of 0.080%), and American (83.1%, a difference of 0.090%).
| Demographics | Rating | Rank | In Labor Force | Age 25-29 |
| Immigrants | Caribbean | 0.0 /100 | #272 | Tragic 83.4% |
| Immigrants | Dominica | 0.0 /100 | #273 | Tragic 83.4% |
| Marshallese | 0.0 /100 | #274 | Tragic 83.3% |
| Samoans | 0.0 /100 | #275 | Tragic 83.3% |
| Immigrants | Honduras | 0.0 /100 | #276 | Tragic 83.3% |
| Africans | 0.0 /100 | #277 | Tragic 83.2% |
| Immigrants | Cuba | 0.0 /100 | #278 | Tragic 83.2% |
| British West Indians | 0.0 /100 | #279 | Tragic 83.2% |
| Dominicans | 0.0 /100 | #280 | Tragic 83.2% |
| Immigrants | Dominican Republic | 0.0 /100 | #281 | Tragic 83.1% |
| Americans | 0.0 /100 | #282 | Tragic 83.1% |
| Immigrants | Azores | 0.0 /100 | #283 | Tragic 83.1% |
| Nicaraguans | 0.0 /100 | #284 | Tragic 83.1% |
| Belizeans | 0.0 /100 | #285 | Tragic 83.1% |
| Mexican American Indians | 0.0 /100 | #286 | Tragic 83.0% |