Paiute vs Belizean In Labor Force | Age 25-29
COMPARE
Paiute
Belizean
In Labor Force | Age 25-29
In Labor Force | Age 25-29 Comparison
Paiute
Belizeans
78.1%
IN LABOR FORCE | AGE 25-29
0.0/ 100
METRIC RATING
340th/ 347
METRIC RANK
83.1%
IN LABOR FORCE | AGE 25-29
0.0/ 100
METRIC RATING
285th/ 347
METRIC RANK
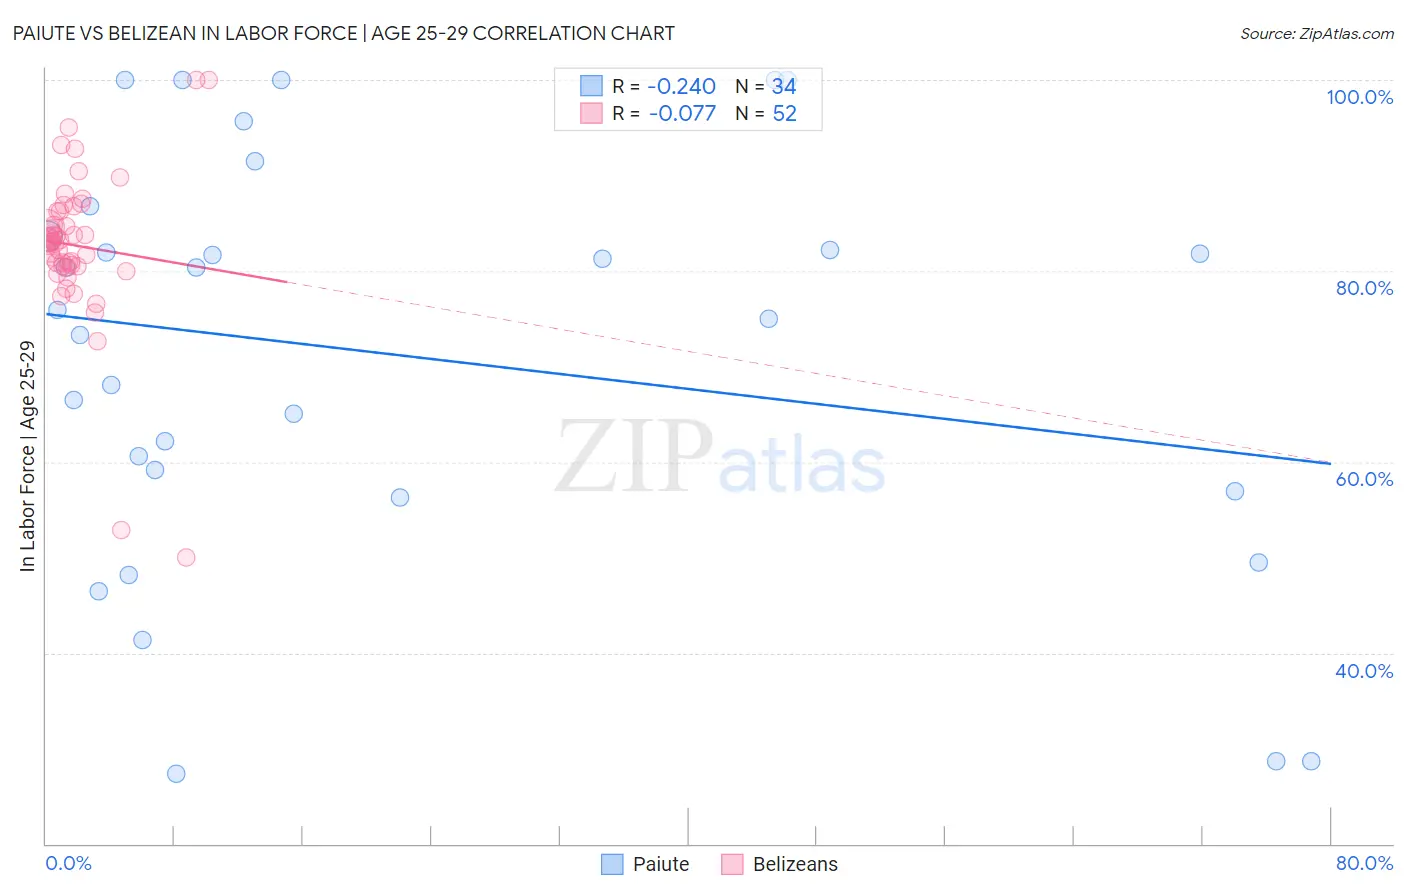
Paiute vs Belizean In Labor Force | Age 25-29 Correlation Chart
The statistical analysis conducted on geographies consisting of 58,387,082 people shows a weak negative correlation between the proportion of Paiute and labor force participation rate among population between the ages 25 and 29 in the United States with a correlation coefficient (R) of -0.240 and weighted average of 78.1%. Similarly, the statistical analysis conducted on geographies consisting of 144,200,012 people shows a slight negative correlation between the proportion of Belizeans and labor force participation rate among population between the ages 25 and 29 in the United States with a correlation coefficient (R) of -0.077 and weighted average of 83.1%, a difference of 6.4%.
In Labor Force | Age 25-29 Correlation Summary
| Measurement | Paiute | Belizean |
| Minimum | 27.3% | 50.0% |
| Maximum | 100.0% | 100.0% |
| Range | 72.7% | 50.0% |
| Mean | 71.1% | 82.6% |
| Median | 75.5% | 83.1% |
| Interquartile 25% (IQ1) | 56.9% | 80.5% |
| Interquartile 75% (IQ3) | 83.6% | 86.3% |
| Interquartile Range (IQR) | 26.7% | 5.8% |
| Standard Deviation (Sample) | 21.5% | 8.3% |
| Standard Deviation (Population) | 21.2% | 8.2% |
Similar Demographics by In Labor Force | Age 25-29
Demographics Similar to Paiute by In Labor Force | Age 25-29
In terms of in labor force | age 25-29, the demographic groups most similar to Paiute are Immigrants from Yemen (78.2%, a difference of 0.16%), Lumbee (78.3%, a difference of 0.28%), Crow (78.6%, a difference of 0.65%), Tohono O'odham (77.5%, a difference of 0.78%), and Pueblo (77.5%, a difference of 0.80%).
| Demographics | Rating | Rank | In Labor Force | Age 25-29 |
| Sioux | 0.0 /100 | #333 | Tragic 79.7% |
| Yuman | 0.0 /100 | #334 | Tragic 79.3% |
| Natives/Alaskans | 0.0 /100 | #335 | Tragic 79.3% |
| Apache | 0.0 /100 | #336 | Tragic 79.2% |
| Crow | 0.0 /100 | #337 | Tragic 78.6% |
| Lumbee | 0.0 /100 | #338 | Tragic 78.3% |
| Immigrants | Yemen | 0.0 /100 | #339 | Tragic 78.2% |
| Paiute | 0.0 /100 | #340 | Tragic 78.1% |
| Tohono O'odham | 0.0 /100 | #341 | Tragic 77.5% |
| Pueblo | 0.0 /100 | #342 | Tragic 77.5% |
| Arapaho | 0.0 /100 | #343 | Tragic 76.6% |
| Hopi | 0.0 /100 | #344 | Tragic 76.5% |
| Navajo | 0.0 /100 | #345 | Tragic 74.6% |
| Pima | 0.0 /100 | #346 | Tragic 74.3% |
| Yup'ik | 0.0 /100 | #347 | Tragic 73.1% |
Demographics Similar to Belizeans by In Labor Force | Age 25-29
In terms of in labor force | age 25-29, the demographic groups most similar to Belizeans are Mexican American Indian (83.0%, a difference of 0.020%), Nicaraguan (83.1%, a difference of 0.030%), Guyanese (83.0%, a difference of 0.030%), American (83.1%, a difference of 0.060%), and Immigrants from the Azores (83.1%, a difference of 0.060%).
| Demographics | Rating | Rank | In Labor Force | Age 25-29 |
| Immigrants | Cuba | 0.0 /100 | #278 | Tragic 83.2% |
| British West Indians | 0.0 /100 | #279 | Tragic 83.2% |
| Dominicans | 0.0 /100 | #280 | Tragic 83.2% |
| Immigrants | Dominican Republic | 0.0 /100 | #281 | Tragic 83.1% |
| Americans | 0.0 /100 | #282 | Tragic 83.1% |
| Immigrants | Azores | 0.0 /100 | #283 | Tragic 83.1% |
| Nicaraguans | 0.0 /100 | #284 | Tragic 83.1% |
| Belizeans | 0.0 /100 | #285 | Tragic 83.1% |
| Mexican American Indians | 0.0 /100 | #286 | Tragic 83.0% |
| Guyanese | 0.0 /100 | #287 | Tragic 83.0% |
| Ottawa | 0.0 /100 | #288 | Tragic 83.0% |
| Immigrants | Micronesia | 0.0 /100 | #289 | Tragic 83.0% |
| Immigrants | Bangladesh | 0.0 /100 | #290 | Tragic 83.0% |
| Hawaiians | 0.0 /100 | #291 | Tragic 83.0% |
| Immigrants | Guyana | 0.0 /100 | #292 | Tragic 83.0% |