Paiute vs Immigrants from Australia 12th Grade, No Diploma
COMPARE
Paiute
Immigrants from Australia
12th Grade, No Diploma
12th Grade, No Diploma Comparison
Paiute
Immigrants from Australia
88.7%
12TH GRADE, NO DIPLOMA
0.0/ 100
METRIC RATING
283rd/ 347
METRIC RANK
92.9%
12TH GRADE, NO DIPLOMA
99.8/ 100
METRIC RATING
42nd/ 347
METRIC RANK
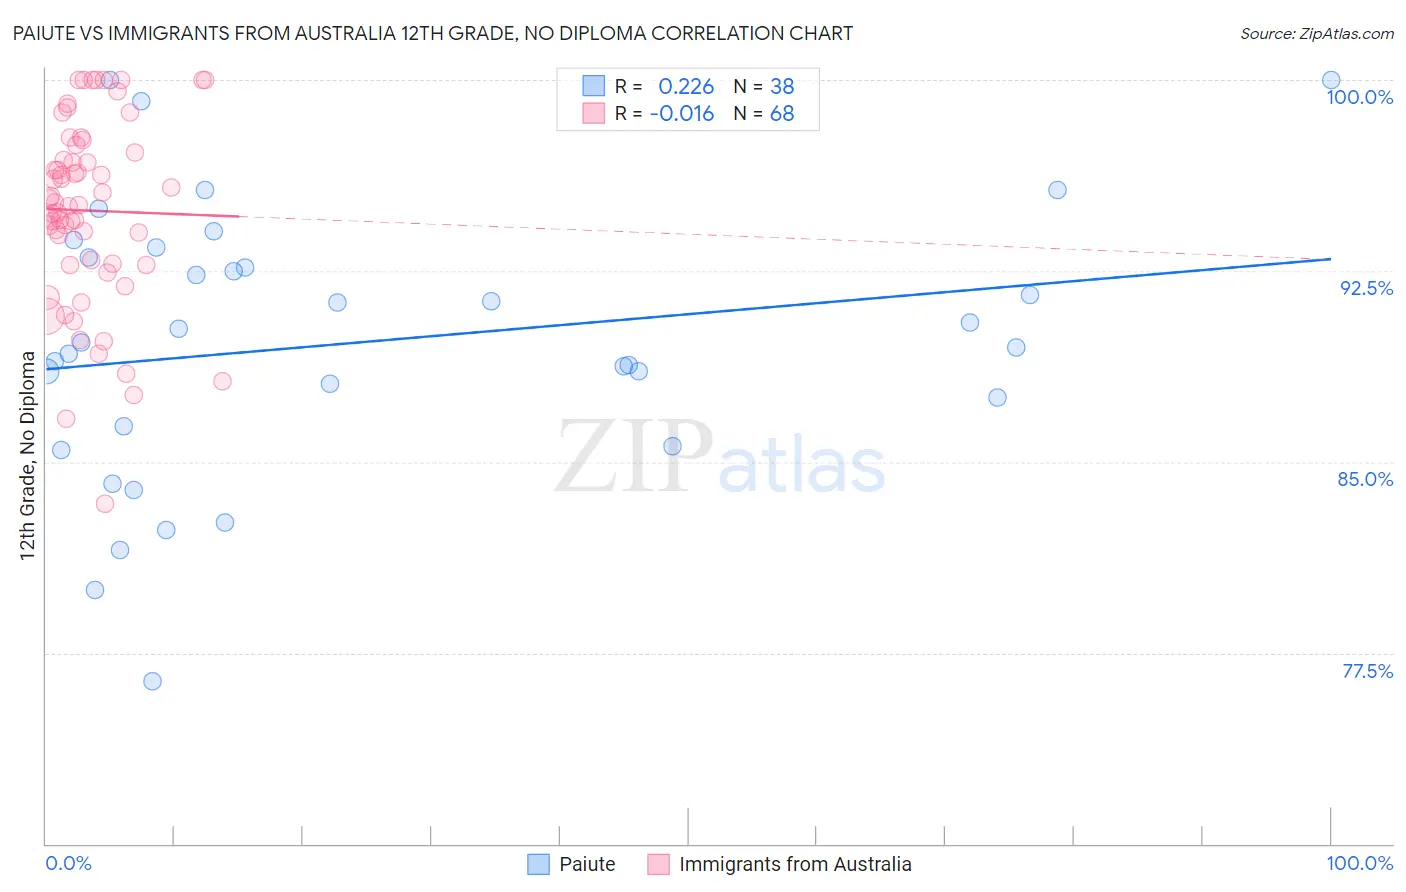
Paiute vs Immigrants from Australia 12th Grade, No Diploma Correlation Chart
The statistical analysis conducted on geographies consisting of 58,404,248 people shows a weak positive correlation between the proportion of Paiute and percentage of population with at least 12th grade (no diploma) education in the United States with a correlation coefficient (R) of 0.226 and weighted average of 88.7%. Similarly, the statistical analysis conducted on geographies consisting of 227,202,828 people shows no correlation between the proportion of Immigrants from Australia and percentage of population with at least 12th grade (no diploma) education in the United States with a correlation coefficient (R) of -0.016 and weighted average of 92.9%, a difference of 4.8%.
12th Grade, No Diploma Correlation Summary
| Measurement | Paiute | Immigrants from Australia |
| Minimum | 76.4% | 83.3% |
| Maximum | 100.0% | 100.0% |
| Range | 23.6% | 16.7% |
| Mean | 89.7% | 94.9% |
| Median | 89.6% | 95.1% |
| Interquartile 25% (IQ1) | 86.4% | 92.7% |
| Interquartile 75% (IQ3) | 93.0% | 97.3% |
| Interquartile Range (IQR) | 6.6% | 4.6% |
| Standard Deviation (Sample) | 5.4% | 3.7% |
| Standard Deviation (Population) | 5.3% | 3.6% |
Similar Demographics by 12th Grade, No Diploma
Demographics Similar to Paiute by 12th Grade, No Diploma
In terms of 12th grade, no diploma, the demographic groups most similar to Paiute are Pennsylvania German (88.7%, a difference of 0.010%), Indonesian (88.6%, a difference of 0.030%), Immigrants from West Indies (88.6%, a difference of 0.030%), Hopi (88.6%, a difference of 0.040%), and Immigrants from Fiji (88.6%, a difference of 0.040%).
| Demographics | Rating | Rank | 12th Grade, No Diploma |
| Ute | 0.1 /100 | #276 | Tragic 89.0% |
| Immigrants | Barbados | 0.0 /100 | #277 | Tragic 89.0% |
| Immigrants | St. Vincent and the Grenadines | 0.0 /100 | #278 | Tragic 88.9% |
| Immigrants | Laos | 0.0 /100 | #279 | Tragic 88.9% |
| Immigrants | Burma/Myanmar | 0.0 /100 | #280 | Tragic 88.9% |
| Cubans | 0.0 /100 | #281 | Tragic 88.9% |
| Immigrants | Vietnam | 0.0 /100 | #282 | Tragic 88.7% |
| Paiute | 0.0 /100 | #283 | Tragic 88.7% |
| Pennsylvania Germans | 0.0 /100 | #284 | Tragic 88.7% |
| Indonesians | 0.0 /100 | #285 | Tragic 88.6% |
| Immigrants | West Indies | 0.0 /100 | #286 | Tragic 88.6% |
| Hopi | 0.0 /100 | #287 | Tragic 88.6% |
| Immigrants | Fiji | 0.0 /100 | #288 | Tragic 88.6% |
| Dutch West Indians | 0.0 /100 | #289 | Tragic 88.5% |
| British West Indians | 0.0 /100 | #290 | Tragic 88.5% |
Demographics Similar to Immigrants from Australia by 12th Grade, No Diploma
In terms of 12th grade, no diploma, the demographic groups most similar to Immigrants from Australia are Turkish (93.0%, a difference of 0.020%), Bhutanese (93.0%, a difference of 0.020%), Northern European (92.9%, a difference of 0.020%), Dutch (92.9%, a difference of 0.020%), and Tlingit-Haida (93.0%, a difference of 0.030%).
| Demographics | Rating | Rank | 12th Grade, No Diploma |
| English | 99.9 /100 | #35 | Exceptional 93.0% |
| Scottish | 99.9 /100 | #36 | Exceptional 93.0% |
| Irish | 99.9 /100 | #37 | Exceptional 93.0% |
| Tlingit-Haida | 99.8 /100 | #38 | Exceptional 93.0% |
| Immigrants | Austria | 99.8 /100 | #39 | Exceptional 93.0% |
| Turks | 99.8 /100 | #40 | Exceptional 93.0% |
| Bhutanese | 99.8 /100 | #41 | Exceptional 93.0% |
| Immigrants | Australia | 99.8 /100 | #42 | Exceptional 92.9% |
| Northern Europeans | 99.8 /100 | #43 | Exceptional 92.9% |
| Dutch | 99.8 /100 | #44 | Exceptional 92.9% |
| Greeks | 99.8 /100 | #45 | Exceptional 92.9% |
| British | 99.8 /100 | #46 | Exceptional 92.9% |
| Belgians | 99.8 /100 | #47 | Exceptional 92.9% |
| Australians | 99.8 /100 | #48 | Exceptional 92.9% |
| Macedonians | 99.8 /100 | #49 | Exceptional 92.9% |