Immigrants from Hungary vs Immigrants from Australia In Labor Force | Age > 16
COMPARE
Immigrants from Hungary
Immigrants from Australia
In Labor Force | Age > 16
In Labor Force | Age > 16 Comparison
Immigrants from Hungary
Immigrants from Australia
64.5%
IN LABOR FORCE | AGE > 16
3.8/ 100
METRIC RATING
239th/ 347
METRIC RANK
65.9%
IN LABOR FORCE | AGE > 16
98.7/ 100
METRIC RATING
99th/ 347
METRIC RANK
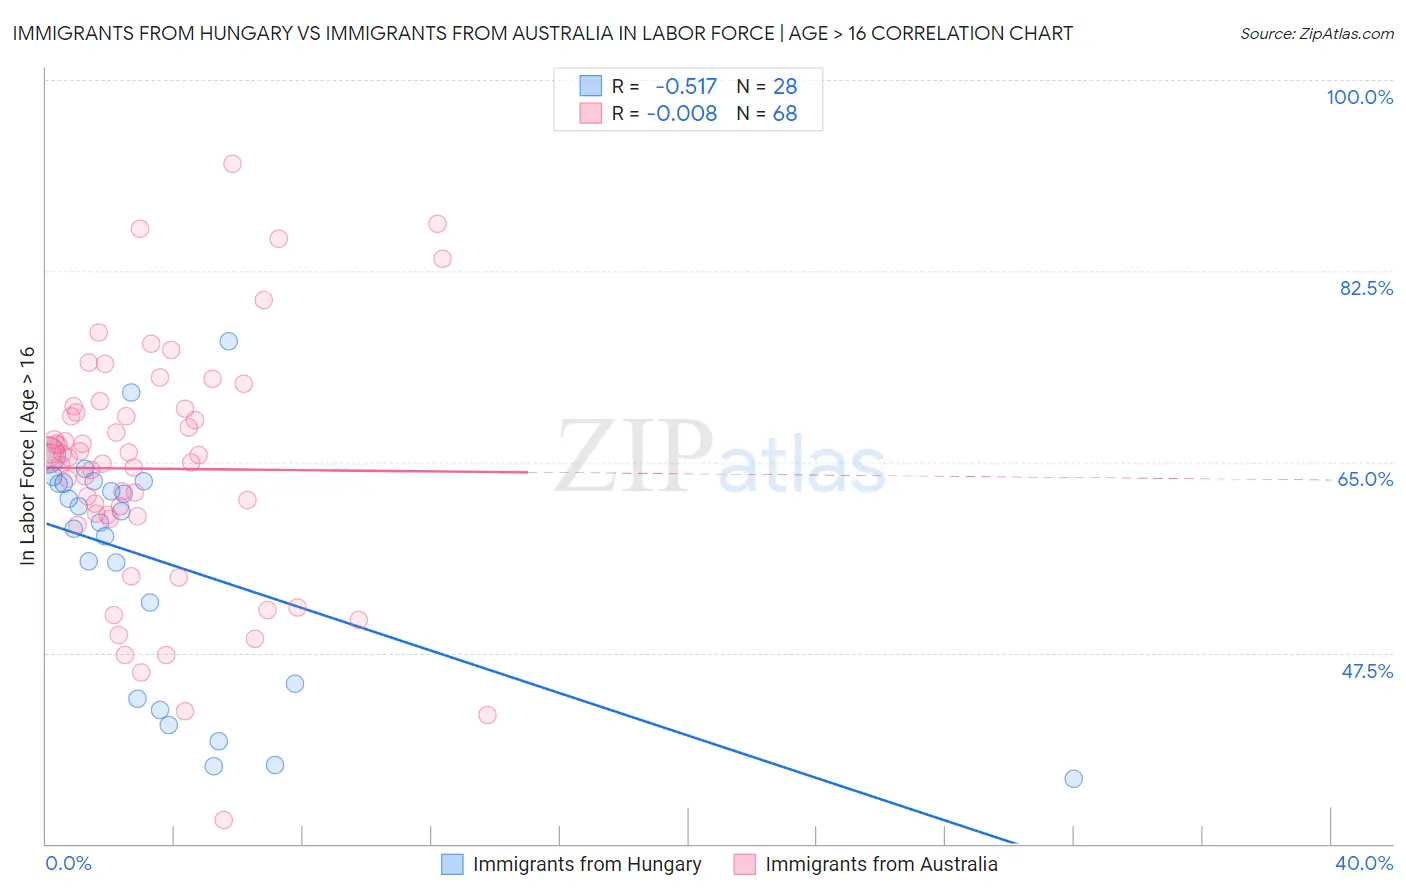
Immigrants from Hungary vs Immigrants from Australia In Labor Force | Age > 16 Correlation Chart
The statistical analysis conducted on geographies consisting of 195,708,395 people shows a substantial negative correlation between the proportion of Immigrants from Hungary and labor force participation rate among population ages 16 and over in the United States with a correlation coefficient (R) of -0.517 and weighted average of 64.5%. Similarly, the statistical analysis conducted on geographies consisting of 227,207,882 people shows no correlation between the proportion of Immigrants from Australia and labor force participation rate among population ages 16 and over in the United States with a correlation coefficient (R) of -0.008 and weighted average of 65.9%, a difference of 2.1%.
In Labor Force | Age > 16 Correlation Summary
| Measurement | Immigrants from Hungary | Immigrants from Australia |
| Minimum | 36.0% | 32.2% |
| Maximum | 76.0% | 92.3% |
| Range | 40.0% | 60.1% |
| Mean | 55.8% | 64.4% |
| Median | 60.0% | 65.7% |
| Interquartile 25% (IQ1) | 44.0% | 60.1% |
| Interquartile 75% (IQ3) | 63.1% | 69.7% |
| Interquartile Range (IQR) | 19.1% | 9.6% |
| Standard Deviation (Sample) | 11.1% | 11.2% |
| Standard Deviation (Population) | 10.9% | 11.1% |
Similar Demographics by In Labor Force | Age > 16
Demographics Similar to Immigrants from Hungary by In Labor Force | Age > 16
In terms of in labor force | age > 16, the demographic groups most similar to Immigrants from Hungary are Lebanese (64.5%, a difference of 0.010%), Immigrants from Bangladesh (64.5%, a difference of 0.020%), Immigrants from Dominica (64.5%, a difference of 0.020%), Immigrants from Netherlands (64.5%, a difference of 0.030%), and Immigrants from Lebanon (64.5%, a difference of 0.050%).
| Demographics | Rating | Rank | In Labor Force | Age > 16 |
| Africans | 5.8 /100 | #232 | Tragic 64.6% |
| Slavs | 4.9 /100 | #233 | Tragic 64.6% |
| Vietnamese | 4.7 /100 | #234 | Tragic 64.6% |
| Austrians | 4.6 /100 | #235 | Tragic 64.6% |
| Immigrants | Norway | 4.6 /100 | #236 | Tragic 64.6% |
| Italians | 4.6 /100 | #237 | Tragic 64.6% |
| Lebanese | 3.9 /100 | #238 | Tragic 64.5% |
| Immigrants | Hungary | 3.8 /100 | #239 | Tragic 64.5% |
| Immigrants | Bangladesh | 3.6 /100 | #240 | Tragic 64.5% |
| Immigrants | Dominica | 3.5 /100 | #241 | Tragic 64.5% |
| Immigrants | Netherlands | 3.4 /100 | #242 | Tragic 64.5% |
| Immigrants | Lebanon | 3.2 /100 | #243 | Tragic 64.5% |
| Tsimshian | 3.1 /100 | #244 | Tragic 64.5% |
| West Indians | 3.0 /100 | #245 | Tragic 64.5% |
| Immigrants | Caribbean | 2.3 /100 | #246 | Tragic 64.4% |
Demographics Similar to Immigrants from Australia by In Labor Force | Age > 16
In terms of in labor force | age > 16, the demographic groups most similar to Immigrants from Australia are Okinawan (65.9%, a difference of 0.0%), Immigrants from Chile (65.9%, a difference of 0.010%), Immigrants from Colombia (65.9%, a difference of 0.010%), Uruguayan (65.9%, a difference of 0.010%), and Immigrants from South Eastern Asia (65.9%, a difference of 0.030%).
| Demographics | Rating | Rank | In Labor Force | Age > 16 |
| Aleuts | 99.1 /100 | #92 | Exceptional 66.0% |
| Immigrants | South America | 99.1 /100 | #93 | Exceptional 66.0% |
| Immigrants | Cambodia | 99.1 /100 | #94 | Exceptional 66.0% |
| Immigrants | Uruguay | 99.1 /100 | #95 | Exceptional 66.0% |
| Bangladeshis | 98.9 /100 | #96 | Exceptional 65.9% |
| Filipinos | 98.9 /100 | #97 | Exceptional 65.9% |
| Immigrants | Chile | 98.7 /100 | #98 | Exceptional 65.9% |
| Immigrants | Australia | 98.7 /100 | #99 | Exceptional 65.9% |
| Okinawans | 98.7 /100 | #100 | Exceptional 65.9% |
| Immigrants | Colombia | 98.6 /100 | #101 | Exceptional 65.9% |
| Uruguayans | 98.6 /100 | #102 | Exceptional 65.9% |
| Immigrants | South Eastern Asia | 98.5 /100 | #103 | Exceptional 65.9% |
| Palestinians | 98.5 /100 | #104 | Exceptional 65.9% |
| Colombians | 98.4 /100 | #105 | Exceptional 65.9% |
| Immigrants | Serbia | 98.1 /100 | #106 | Exceptional 65.8% |