Paiute vs Estonian Unemployment Among Ages 25 to 29 years
COMPARE
Paiute
Estonian
Unemployment Among Ages 25 to 29 years
Unemployment Among Ages 25 to 29 years Comparison
Paiute
Estonians
7.4%
UNEMPLOYMENT AMONG AGES 25 TO 29 YEARS
0.1/ 100
METRIC RATING
266th/ 347
METRIC RANK
6.6%
UNEMPLOYMENT AMONG AGES 25 TO 29 YEARS
54.8/ 100
METRIC RATING
168th/ 347
METRIC RANK
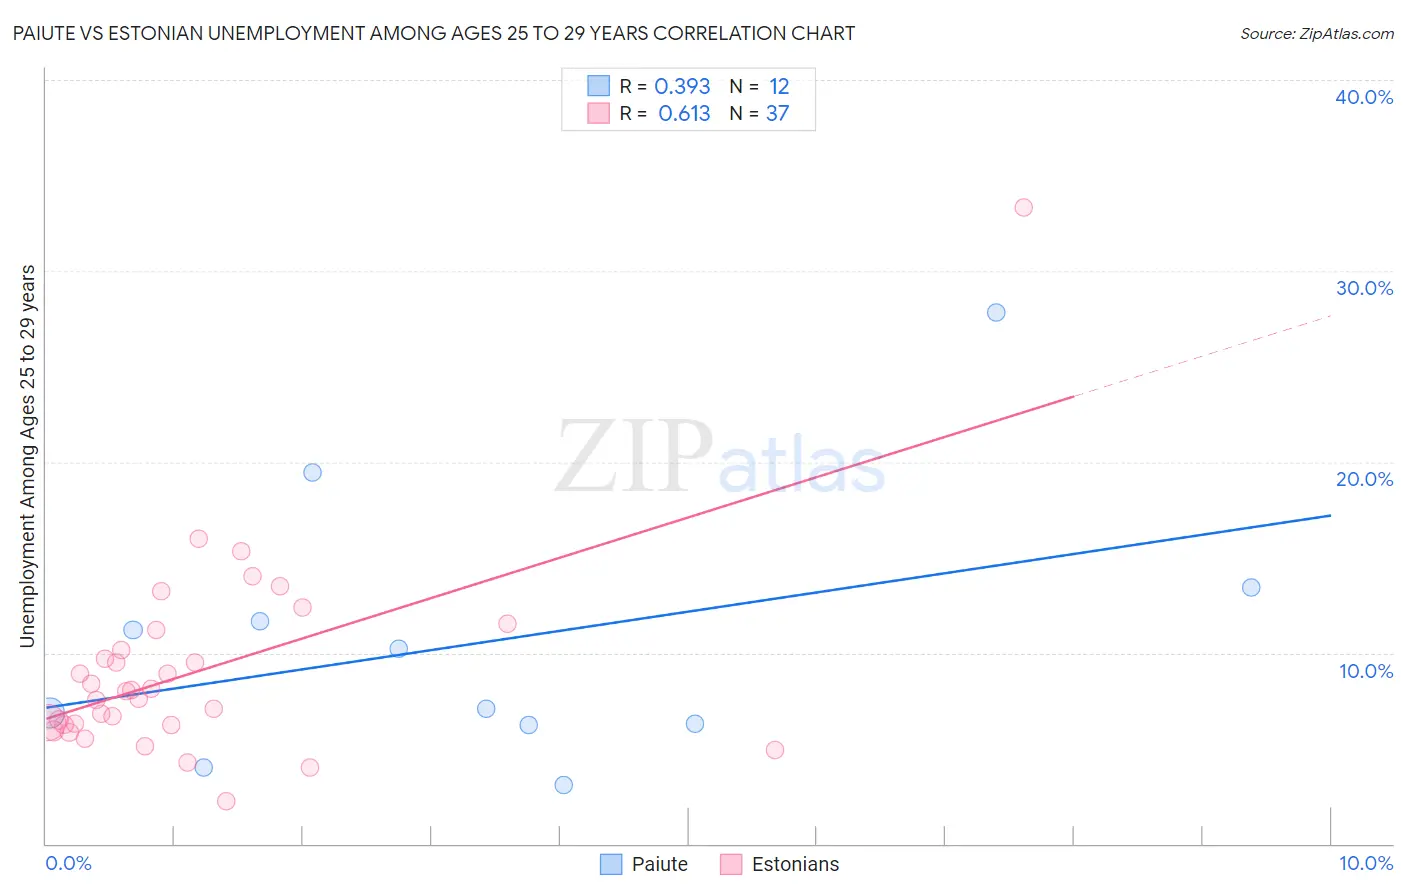
Paiute vs Estonian Unemployment Among Ages 25 to 29 years Correlation Chart
The statistical analysis conducted on geographies consisting of 57,773,111 people shows a mild positive correlation between the proportion of Paiute and unemployment rate among population between the ages 25 and 29 in the United States with a correlation coefficient (R) of 0.393 and weighted average of 7.4%. Similarly, the statistical analysis conducted on geographies consisting of 120,865,167 people shows a significant positive correlation between the proportion of Estonians and unemployment rate among population between the ages 25 and 29 in the United States with a correlation coefficient (R) of 0.613 and weighted average of 6.6%, a difference of 11.8%.
Unemployment Among Ages 25 to 29 years Correlation Summary
| Measurement | Paiute | Estonian |
| Minimum | 3.1% | 2.2% |
| Maximum | 27.8% | 33.3% |
| Range | 24.7% | 31.1% |
| Mean | 10.6% | 9.0% |
| Median | 8.7% | 8.0% |
| Interquartile 25% (IQ1) | 6.2% | 6.2% |
| Interquartile 75% (IQ3) | 12.5% | 10.7% |
| Interquartile Range (IQR) | 6.3% | 4.5% |
| Standard Deviation (Sample) | 7.1% | 5.2% |
| Standard Deviation (Population) | 6.8% | 5.2% |
Similar Demographics by Unemployment Among Ages 25 to 29 years
Demographics Similar to Paiute by Unemployment Among Ages 25 to 29 years
In terms of unemployment among ages 25 to 29 years, the demographic groups most similar to Paiute are Pennsylvania German (7.4%, a difference of 0.070%), Immigrants from Ecuador (7.4%, a difference of 0.090%), Immigrants from Fiji (7.4%, a difference of 0.14%), Immigrants from Latin America (7.4%, a difference of 0.15%), and Immigrants from Western Africa (7.4%, a difference of 0.21%).
| Demographics | Rating | Rank | Unemployment Among Ages 25 to 29 years |
| Cree | 0.1 /100 | #259 | Tragic 7.3% |
| Americans | 0.1 /100 | #260 | Tragic 7.4% |
| Nigerians | 0.1 /100 | #261 | Tragic 7.4% |
| Ecuadorians | 0.1 /100 | #262 | Tragic 7.4% |
| Kiowa | 0.1 /100 | #263 | Tragic 7.4% |
| Immigrants | Western Africa | 0.1 /100 | #264 | Tragic 7.4% |
| Immigrants | Fiji | 0.1 /100 | #265 | Tragic 7.4% |
| Paiute | 0.1 /100 | #266 | Tragic 7.4% |
| Pennsylvania Germans | 0.1 /100 | #267 | Tragic 7.4% |
| Immigrants | Ecuador | 0.1 /100 | #268 | Tragic 7.4% |
| Immigrants | Latin America | 0.1 /100 | #269 | Tragic 7.4% |
| Bahamians | 0.0 /100 | #270 | Tragic 7.5% |
| Choctaw | 0.0 /100 | #271 | Tragic 7.5% |
| Immigrants | Bahamas | 0.0 /100 | #272 | Tragic 7.5% |
| Immigrants | Nigeria | 0.0 /100 | #273 | Tragic 7.5% |
Demographics Similar to Estonians by Unemployment Among Ages 25 to 29 years
In terms of unemployment among ages 25 to 29 years, the demographic groups most similar to Estonians are Immigrants from Canada (6.6%, a difference of 0.020%), South American (6.6%, a difference of 0.020%), Albanian (6.6%, a difference of 0.080%), Immigrants from Cambodia (6.6%, a difference of 0.14%), and Immigrants from Northern Europe (6.6%, a difference of 0.16%).
| Demographics | Rating | Rank | Unemployment Among Ages 25 to 29 years |
| Paraguayans | 60.4 /100 | #161 | Good 6.6% |
| Immigrants | Czechoslovakia | 60.2 /100 | #162 | Good 6.6% |
| Immigrants | Middle Africa | 59.4 /100 | #163 | Average 6.6% |
| Greeks | 58.5 /100 | #164 | Average 6.6% |
| English | 58.0 /100 | #165 | Average 6.6% |
| Immigrants | Northern Europe | 57.3 /100 | #166 | Average 6.6% |
| Immigrants | Canada | 55.0 /100 | #167 | Average 6.6% |
| Estonians | 54.8 /100 | #168 | Average 6.6% |
| South Americans | 54.5 /100 | #169 | Average 6.6% |
| Albanians | 53.5 /100 | #170 | Average 6.6% |
| Immigrants | Cambodia | 52.6 /100 | #171 | Average 6.6% |
| Bangladeshis | 51.6 /100 | #172 | Average 6.6% |
| Russians | 51.3 /100 | #173 | Average 6.6% |
| Immigrants | North America | 50.0 /100 | #174 | Average 6.6% |
| Immigrants | South Eastern Asia | 49.1 /100 | #175 | Average 6.7% |