Paiute vs Argentinean In Labor Force | Age 16-19
COMPARE
Paiute
Argentinean
In Labor Force | Age 16-19
In Labor Force | Age 16-19 Comparison
Paiute
Argentineans
37.5%
IN LABOR FORCE | AGE 16-19
89.3/ 100
METRIC RATING
145th/ 347
METRIC RANK
33.3%
IN LABOR FORCE | AGE 16-19
0.1/ 100
METRIC RATING
294th/ 347
METRIC RANK
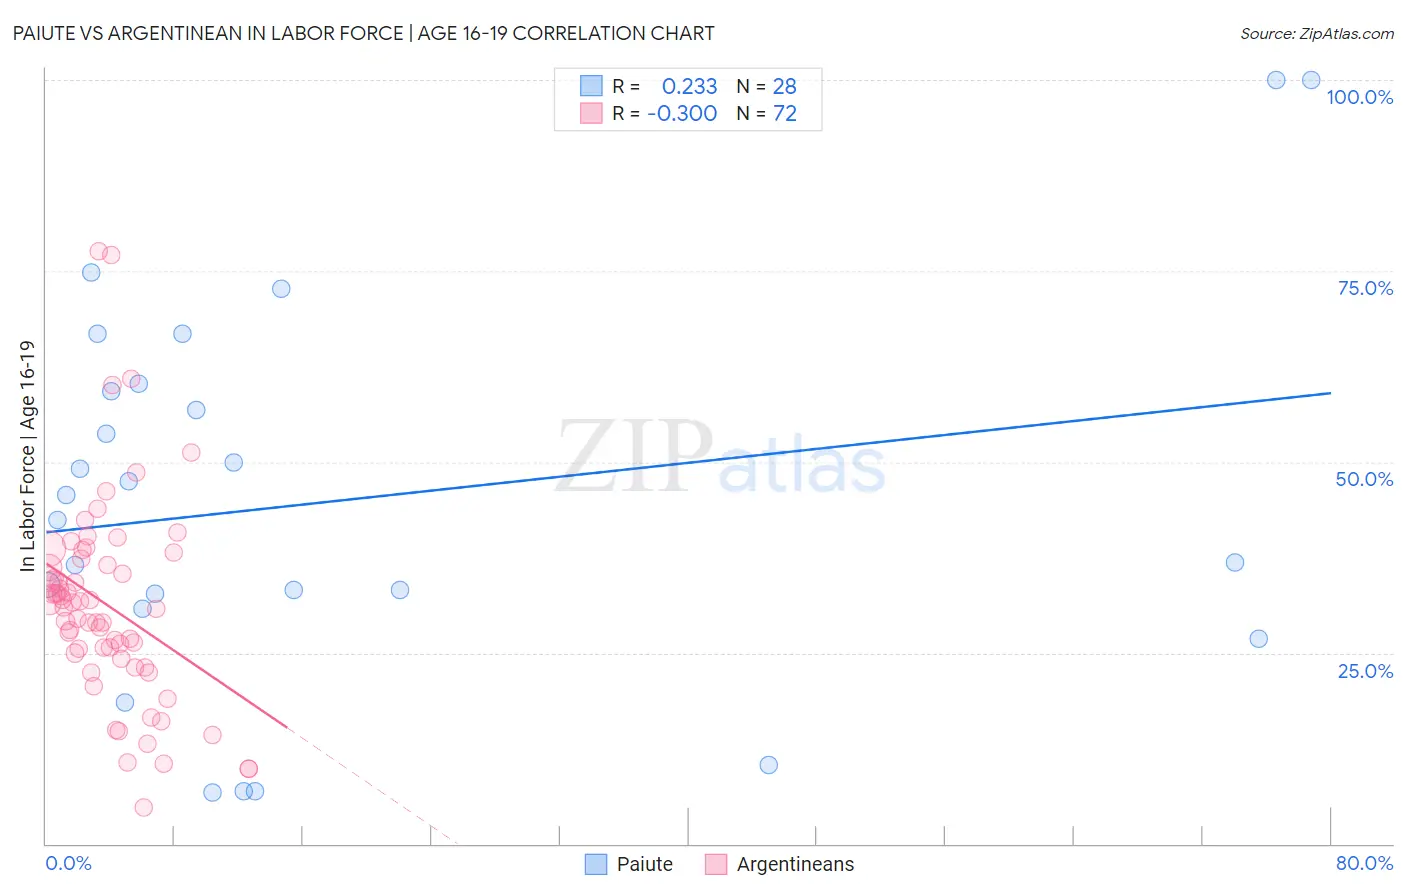
Paiute vs Argentinean In Labor Force | Age 16-19 Correlation Chart
The statistical analysis conducted on geographies consisting of 58,354,197 people shows a weak positive correlation between the proportion of Paiute and labor force participation rate among population between the ages 16 and 19 in the United States with a correlation coefficient (R) of 0.233 and weighted average of 37.5%. Similarly, the statistical analysis conducted on geographies consisting of 296,834,136 people shows a mild negative correlation between the proportion of Argentineans and labor force participation rate among population between the ages 16 and 19 in the United States with a correlation coefficient (R) of -0.300 and weighted average of 33.3%, a difference of 12.8%.
In Labor Force | Age 16-19 Correlation Summary
| Measurement | Paiute | Argentinean |
| Minimum | 6.7% | 4.8% |
| Maximum | 100.0% | 77.6% |
| Range | 93.3% | 72.8% |
| Mean | 45.0% | 31.3% |
| Median | 44.1% | 31.2% |
| Interquartile 25% (IQ1) | 31.7% | 24.6% |
| Interquartile 75% (IQ3) | 59.8% | 36.9% |
| Interquartile Range (IQR) | 28.1% | 12.3% |
| Standard Deviation (Sample) | 25.0% | 13.4% |
| Standard Deviation (Population) | 24.5% | 13.3% |
Similar Demographics by In Labor Force | Age 16-19
Demographics Similar to Paiute by In Labor Force | Age 16-19
In terms of in labor force | age 16-19, the demographic groups most similar to Paiute are Japanese (37.5%, a difference of 0.0%), Pakistani (37.6%, a difference of 0.020%), Sierra Leonean (37.6%, a difference of 0.050%), Immigrants from Western Europe (37.5%, a difference of 0.050%), and Brazilian (37.5%, a difference of 0.080%).
| Demographics | Rating | Rank | In Labor Force | Age 16-19 |
| Comanche | 91.9 /100 | #138 | Exceptional 37.7% |
| Immigrants | Moldova | 91.9 /100 | #139 | Exceptional 37.7% |
| Estonians | 91.7 /100 | #140 | Exceptional 37.7% |
| Syrians | 90.7 /100 | #141 | Exceptional 37.6% |
| Sierra Leoneans | 89.7 /100 | #142 | Excellent 37.6% |
| Pakistanis | 89.5 /100 | #143 | Excellent 37.6% |
| Japanese | 89.3 /100 | #144 | Excellent 37.5% |
| Paiute | 89.3 /100 | #145 | Excellent 37.5% |
| Immigrants | Western Europe | 88.9 /100 | #146 | Excellent 37.5% |
| Brazilians | 88.7 /100 | #147 | Excellent 37.5% |
| Romanians | 87.3 /100 | #148 | Excellent 37.5% |
| Native Hawaiians | 85.0 /100 | #149 | Excellent 37.4% |
| Tsimshian | 84.7 /100 | #150 | Excellent 37.4% |
| Immigrants | Poland | 84.4 /100 | #151 | Excellent 37.3% |
| Immigrants | Sierra Leone | 83.6 /100 | #152 | Excellent 37.3% |
Demographics Similar to Argentineans by In Labor Force | Age 16-19
In terms of in labor force | age 16-19, the demographic groups most similar to Argentineans are Immigrants from South America (33.3%, a difference of 0.020%), Yup'ik (33.3%, a difference of 0.10%), Jamaican (33.2%, a difference of 0.23%), Immigrants from Haiti (33.2%, a difference of 0.33%), and Haitian (33.4%, a difference of 0.34%).
| Demographics | Rating | Rank | In Labor Force | Age 16-19 |
| Nepalese | 0.1 /100 | #287 | Tragic 33.5% |
| Immigrants | Indonesia | 0.1 /100 | #288 | Tragic 33.5% |
| Immigrants | Singapore | 0.1 /100 | #289 | Tragic 33.5% |
| Immigrants | Colombia | 0.1 /100 | #290 | Tragic 33.5% |
| Immigrants | Belarus | 0.1 /100 | #291 | Tragic 33.4% |
| Haitians | 0.1 /100 | #292 | Tragic 33.4% |
| Immigrants | South America | 0.1 /100 | #293 | Tragic 33.3% |
| Argentineans | 0.1 /100 | #294 | Tragic 33.3% |
| Yup'ik | 0.1 /100 | #295 | Tragic 33.3% |
| Jamaicans | 0.1 /100 | #296 | Tragic 33.2% |
| Immigrants | Haiti | 0.1 /100 | #297 | Tragic 33.2% |
| Iranians | 0.0 /100 | #298 | Tragic 33.0% |
| Armenians | 0.0 /100 | #299 | Tragic 32.9% |
| Immigrants | Argentina | 0.0 /100 | #300 | Tragic 32.9% |
| Okinawans | 0.0 /100 | #301 | Tragic 32.8% |