Osage vs Ethiopian In Labor Force | Age 25-29
COMPARE
Osage
Ethiopian
In Labor Force | Age 25-29
In Labor Force | Age 25-29 Comparison
Osage
Ethiopians
82.3%
IN LABOR FORCE | AGE 25-29
0.0/ 100
METRIC RATING
310th/ 347
METRIC RANK
86.2%
IN LABOR FORCE | AGE 25-29
100.0/ 100
METRIC RATING
9th/ 347
METRIC RANK
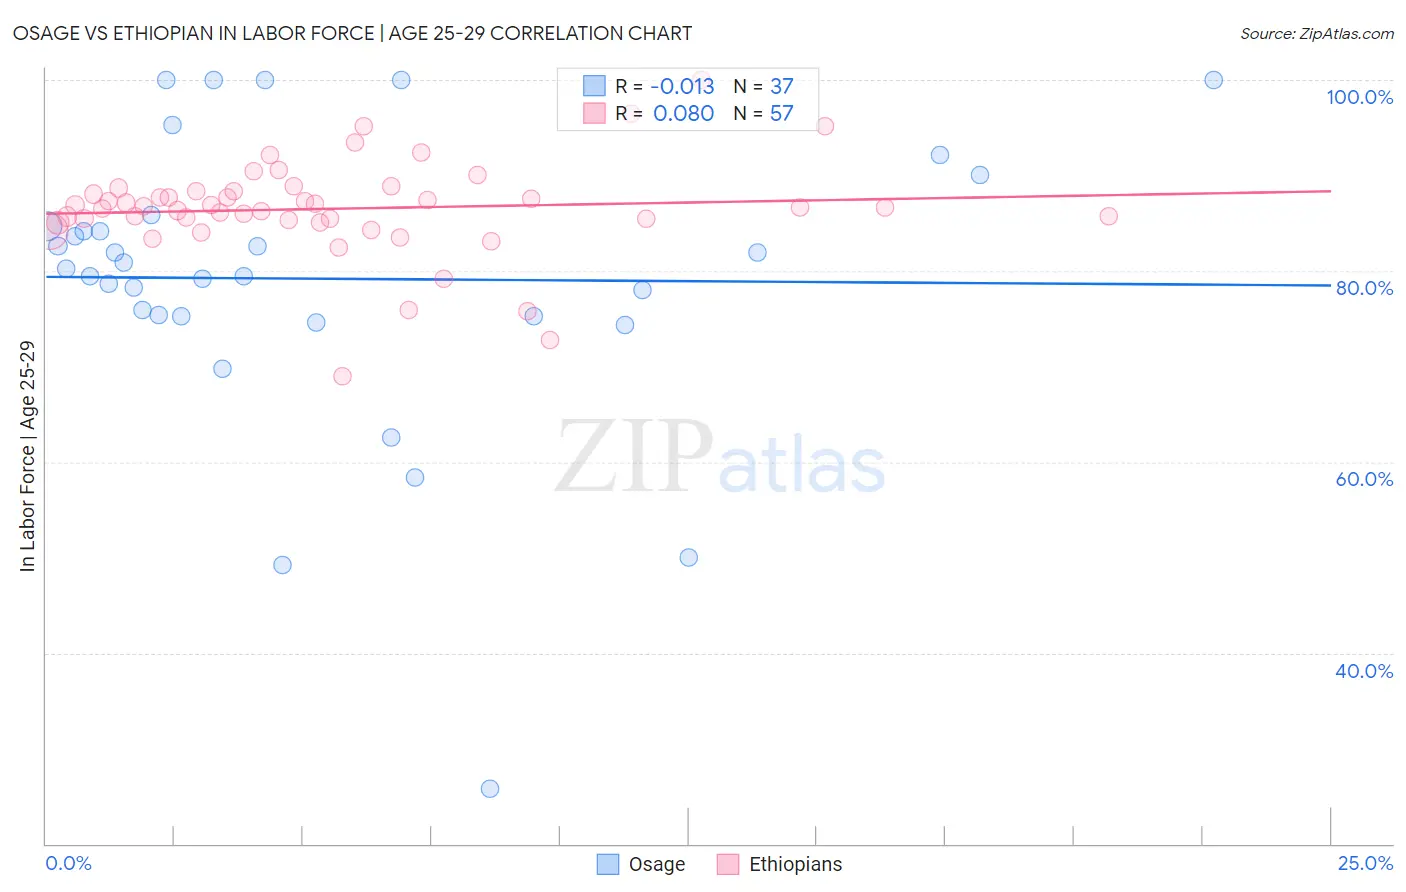
Osage vs Ethiopian In Labor Force | Age 25-29 Correlation Chart
The statistical analysis conducted on geographies consisting of 91,794,280 people shows no correlation between the proportion of Osage and labor force participation rate among population between the ages 25 and 29 in the United States with a correlation coefficient (R) of -0.013 and weighted average of 82.3%. Similarly, the statistical analysis conducted on geographies consisting of 223,220,126 people shows a slight positive correlation between the proportion of Ethiopians and labor force participation rate among population between the ages 25 and 29 in the United States with a correlation coefficient (R) of 0.080 and weighted average of 86.2%, a difference of 4.7%.
In Labor Force | Age 25-29 Correlation Summary
| Measurement | Osage | Ethiopian |
| Minimum | 25.7% | 69.0% |
| Maximum | 100.0% | 100.0% |
| Range | 74.3% | 31.0% |
| Mean | 79.2% | 86.5% |
| Median | 80.2% | 86.7% |
| Interquartile 25% (IQ1) | 75.3% | 85.2% |
| Interquartile 75% (IQ3) | 85.2% | 88.4% |
| Interquartile Range (IQR) | 9.9% | 3.2% |
| Standard Deviation (Sample) | 15.3% | 5.1% |
| Standard Deviation (Population) | 15.1% | 5.1% |
Similar Demographics by In Labor Force | Age 25-29
Demographics Similar to Osage by In Labor Force | Age 25-29
In terms of in labor force | age 25-29, the demographic groups most similar to Osage are Alaskan Athabascan (82.3%, a difference of 0.010%), Hispanic or Latino (82.2%, a difference of 0.080%), Immigrants from Central America (82.4%, a difference of 0.14%), Central American Indian (82.4%, a difference of 0.15%), and Yaqui (82.2%, a difference of 0.17%).
| Demographics | Rating | Rank | In Labor Force | Age 25-29 |
| Immigrants | Grenada | 0.0 /100 | #303 | Tragic 82.8% |
| Immigrants | St. Vincent and the Grenadines | 0.0 /100 | #304 | Tragic 82.7% |
| Blacks/African Americans | 0.0 /100 | #305 | Tragic 82.6% |
| Blackfeet | 0.0 /100 | #306 | Tragic 82.6% |
| Cajuns | 0.0 /100 | #307 | Tragic 82.5% |
| Central American Indians | 0.0 /100 | #308 | Tragic 82.4% |
| Immigrants | Central America | 0.0 /100 | #309 | Tragic 82.4% |
| Osage | 0.0 /100 | #310 | Tragic 82.3% |
| Alaskan Athabascans | 0.0 /100 | #311 | Tragic 82.3% |
| Hispanics or Latinos | 0.0 /100 | #312 | Tragic 82.2% |
| Yaqui | 0.0 /100 | #313 | Tragic 82.2% |
| Cherokee | 0.0 /100 | #314 | Tragic 82.1% |
| Immigrants | Mexico | 0.0 /100 | #315 | Tragic 82.0% |
| Mexicans | 0.0 /100 | #316 | Tragic 81.9% |
| Chickasaw | 0.0 /100 | #317 | Tragic 81.9% |
Demographics Similar to Ethiopians by In Labor Force | Age 25-29
In terms of in labor force | age 25-29, the demographic groups most similar to Ethiopians are Immigrants from Cabo Verde (86.2%, a difference of 0.030%), Liberian (86.1%, a difference of 0.050%), Immigrants from Ethiopia (86.1%, a difference of 0.050%), Immigrants from Lithuania (86.1%, a difference of 0.060%), and Norwegian (86.1%, a difference of 0.070%).
| Demographics | Rating | Rank | In Labor Force | Age 25-29 |
| Immigrants | Somalia | 100.0 /100 | #2 | Exceptional 87.1% |
| Somalis | 100.0 /100 | #3 | Exceptional 87.1% |
| Carpatho Rusyns | 100.0 /100 | #4 | Exceptional 87.0% |
| Luxembourgers | 100.0 /100 | #5 | Exceptional 86.9% |
| Slovenes | 100.0 /100 | #6 | Exceptional 86.4% |
| Immigrants | Bosnia and Herzegovina | 100.0 /100 | #7 | Exceptional 86.3% |
| Immigrants | Cabo Verde | 100.0 /100 | #8 | Exceptional 86.2% |
| Ethiopians | 100.0 /100 | #9 | Exceptional 86.2% |
| Liberians | 100.0 /100 | #10 | Exceptional 86.1% |
| Immigrants | Ethiopia | 100.0 /100 | #11 | Exceptional 86.1% |
| Immigrants | Lithuania | 100.0 /100 | #12 | Exceptional 86.1% |
| Norwegians | 100.0 /100 | #13 | Exceptional 86.1% |
| Latvians | 100.0 /100 | #14 | Exceptional 86.1% |
| Bolivians | 100.0 /100 | #15 | Exceptional 86.1% |
| Immigrants | Bolivia | 100.0 /100 | #16 | Exceptional 86.1% |