Black/African American vs Ute In Labor Force | Age 25-29
COMPARE
Black/African American
Ute
In Labor Force | Age 25-29
In Labor Force | Age 25-29 Comparison
Blacks/African Americans
Ute
82.6%
IN LABOR FORCE | AGE 25-29
0.0/ 100
METRIC RATING
305th/ 347
METRIC RANK
80.8%
IN LABOR FORCE | AGE 25-29
0.0/ 100
METRIC RATING
327th/ 347
METRIC RANK
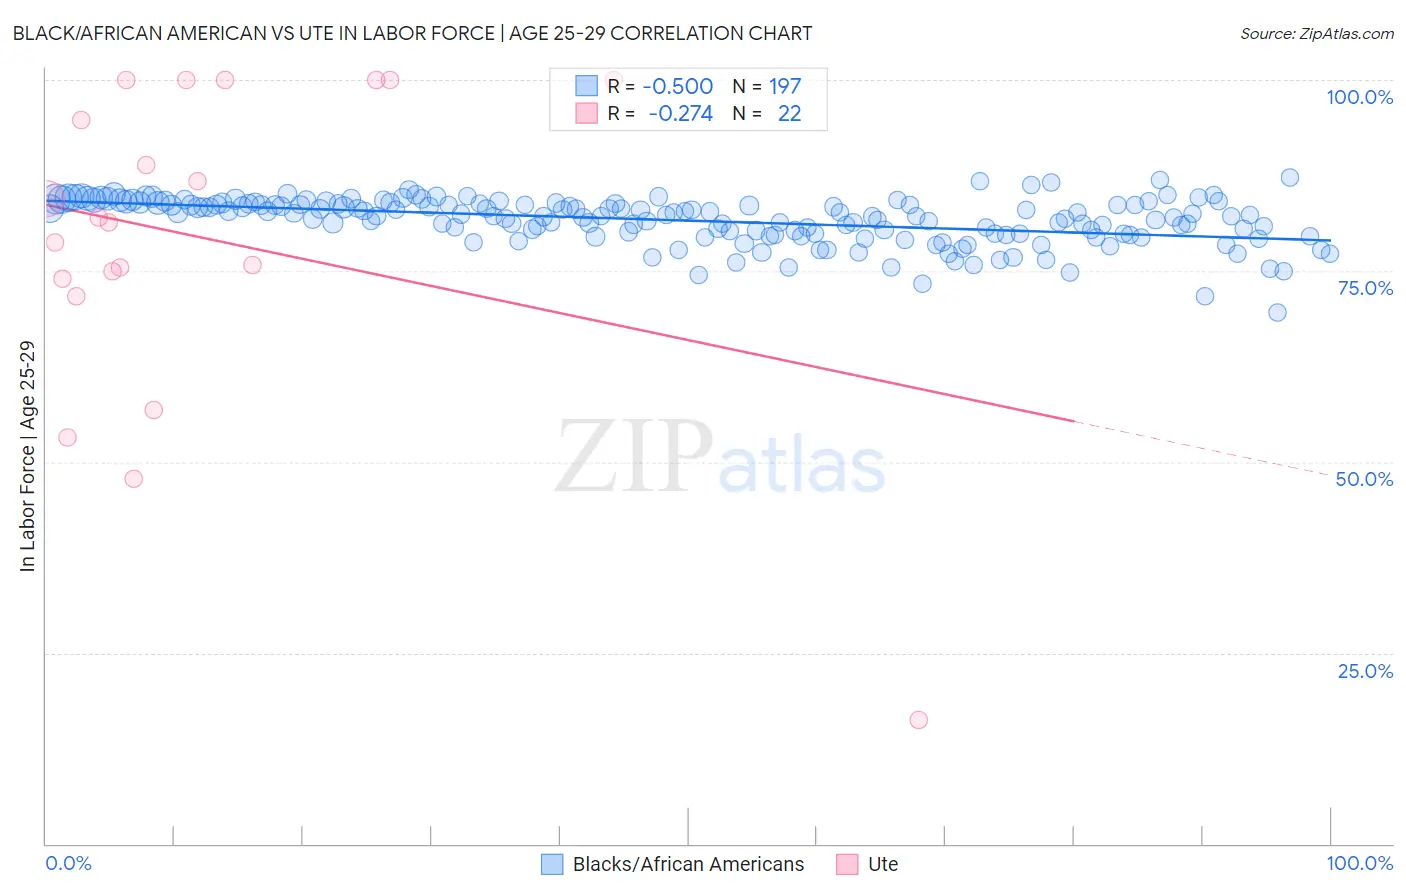
Black/African American vs Ute In Labor Force | Age 25-29 Correlation Chart
The statistical analysis conducted on geographies consisting of 565,000,978 people shows a moderate negative correlation between the proportion of Blacks/African Americans and labor force participation rate among population between the ages 25 and 29 in the United States with a correlation coefficient (R) of -0.500 and weighted average of 82.6%. Similarly, the statistical analysis conducted on geographies consisting of 55,662,248 people shows a weak negative correlation between the proportion of Ute and labor force participation rate among population between the ages 25 and 29 in the United States with a correlation coefficient (R) of -0.274 and weighted average of 80.8%, a difference of 2.2%.
In Labor Force | Age 25-29 Correlation Summary
| Measurement | Black/African American | Ute |
| Minimum | 69.5% | 16.2% |
| Maximum | 87.2% | 100.0% |
| Range | 17.6% | 83.8% |
| Mean | 81.6% | 79.2% |
| Median | 82.3% | 81.7% |
| Interquartile 25% (IQ1) | 79.8% | 73.9% |
| Interquartile 75% (IQ3) | 83.9% | 100.0% |
| Interquartile Range (IQR) | 4.0% | 26.1% |
| Standard Deviation (Sample) | 3.0% | 21.0% |
| Standard Deviation (Population) | 3.0% | 20.5% |
Similar Demographics by In Labor Force | Age 25-29
Demographics Similar to Blacks/African Americans by In Labor Force | Age 25-29
In terms of in labor force | age 25-29, the demographic groups most similar to Blacks/African Americans are Blackfeet (82.6%, a difference of 0.010%), Cajun (82.5%, a difference of 0.060%), Immigrants from St. Vincent and the Grenadines (82.7%, a difference of 0.12%), Central American Indian (82.4%, a difference of 0.21%), and Immigrants from Central America (82.4%, a difference of 0.22%).
| Demographics | Rating | Rank | In Labor Force | Age 25-29 |
| Native Hawaiians | 0.0 /100 | #298 | Tragic 82.9% |
| Fijians | 0.0 /100 | #299 | Tragic 82.9% |
| Spanish American Indians | 0.0 /100 | #300 | Tragic 82.9% |
| Vietnamese | 0.0 /100 | #301 | Tragic 82.8% |
| Immigrants | Belize | 0.0 /100 | #302 | Tragic 82.8% |
| Immigrants | Grenada | 0.0 /100 | #303 | Tragic 82.8% |
| Immigrants | St. Vincent and the Grenadines | 0.0 /100 | #304 | Tragic 82.7% |
| Blacks/African Americans | 0.0 /100 | #305 | Tragic 82.6% |
| Blackfeet | 0.0 /100 | #306 | Tragic 82.6% |
| Cajuns | 0.0 /100 | #307 | Tragic 82.5% |
| Central American Indians | 0.0 /100 | #308 | Tragic 82.4% |
| Immigrants | Central America | 0.0 /100 | #309 | Tragic 82.4% |
| Osage | 0.0 /100 | #310 | Tragic 82.3% |
| Alaskan Athabascans | 0.0 /100 | #311 | Tragic 82.3% |
| Hispanics or Latinos | 0.0 /100 | #312 | Tragic 82.2% |
Demographics Similar to Ute by In Labor Force | Age 25-29
In terms of in labor force | age 25-29, the demographic groups most similar to Ute are Creek (80.7%, a difference of 0.15%), Choctaw (81.0%, a difference of 0.20%), Yakama (80.6%, a difference of 0.26%), Dutch West Indian (81.1%, a difference of 0.41%), and Puerto Rican (80.4%, a difference of 0.48%).
| Demographics | Rating | Rank | In Labor Force | Age 25-29 |
| Colville | 0.0 /100 | #320 | Tragic 81.6% |
| Shoshone | 0.0 /100 | #321 | Tragic 81.6% |
| Kiowa | 0.0 /100 | #322 | Tragic 81.6% |
| Alaska Natives | 0.0 /100 | #323 | Tragic 81.6% |
| Houma | 0.0 /100 | #324 | Tragic 81.2% |
| Dutch West Indians | 0.0 /100 | #325 | Tragic 81.1% |
| Choctaw | 0.0 /100 | #326 | Tragic 81.0% |
| Ute | 0.0 /100 | #327 | Tragic 80.8% |
| Creek | 0.0 /100 | #328 | Tragic 80.7% |
| Yakama | 0.0 /100 | #329 | Tragic 80.6% |
| Puerto Ricans | 0.0 /100 | #330 | Tragic 80.4% |
| Cheyenne | 0.0 /100 | #331 | Tragic 80.3% |
| Inupiat | 0.0 /100 | #332 | Tragic 79.8% |
| Sioux | 0.0 /100 | #333 | Tragic 79.7% |
| Yuman | 0.0 /100 | #334 | Tragic 79.3% |