Immigrants from Latvia vs Pakistani In Labor Force | Age 16-19
COMPARE
Immigrants from Latvia
Pakistani
In Labor Force | Age 16-19
In Labor Force | Age 16-19 Comparison
Immigrants from Latvia
Pakistanis
36.8%
IN LABOR FORCE | AGE 16-19
61.6/ 100
METRIC RATING
169th/ 347
METRIC RANK
37.6%
IN LABOR FORCE | AGE 16-19
89.5/ 100
METRIC RATING
143rd/ 347
METRIC RANK
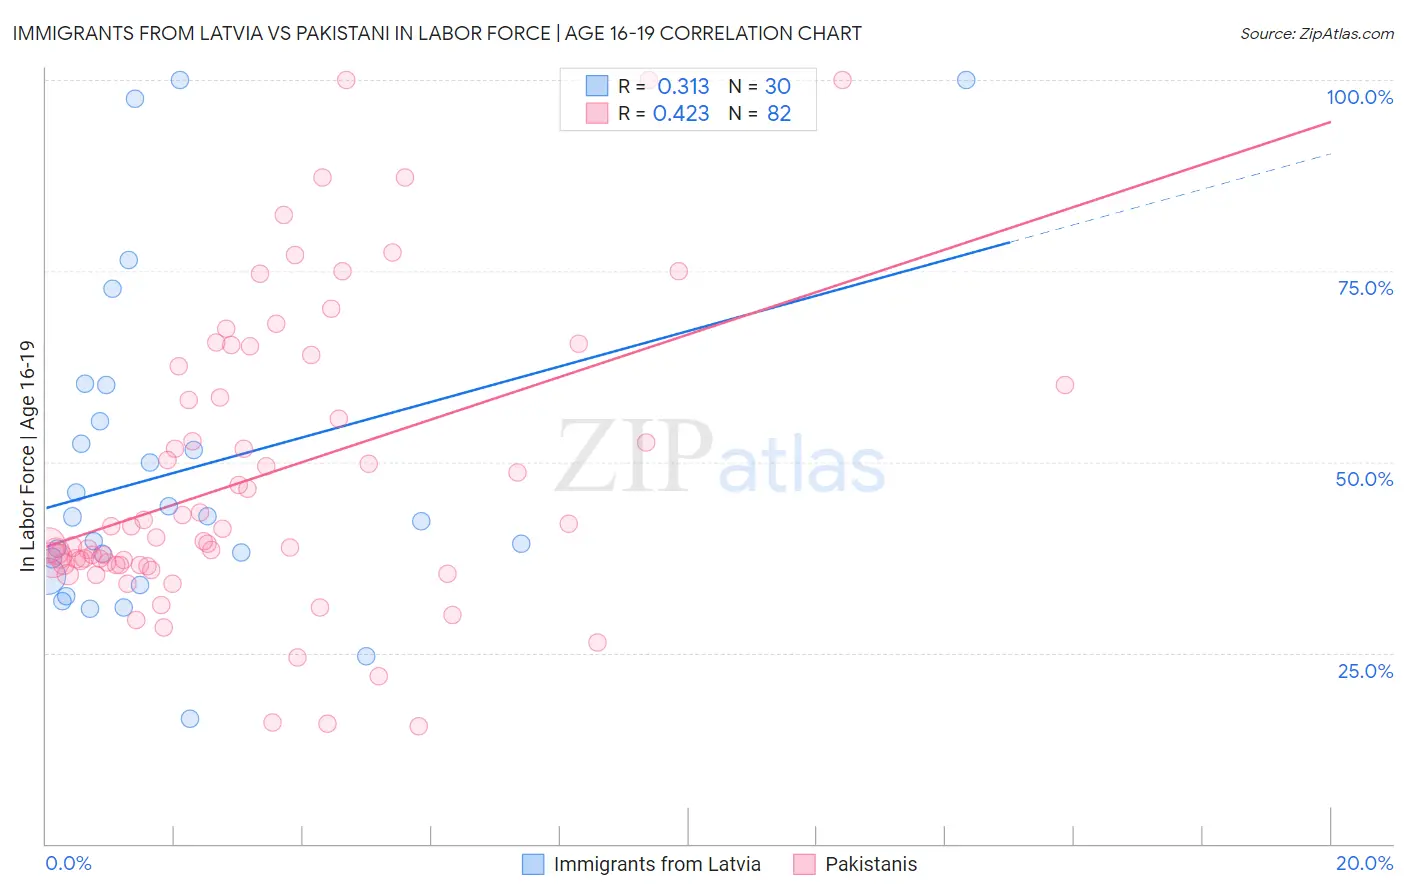
Immigrants from Latvia vs Pakistani In Labor Force | Age 16-19 Correlation Chart
The statistical analysis conducted on geographies consisting of 113,686,535 people shows a mild positive correlation between the proportion of Immigrants from Latvia and labor force participation rate among population between the ages 16 and 19 in the United States with a correlation coefficient (R) of 0.313 and weighted average of 36.8%. Similarly, the statistical analysis conducted on geographies consisting of 335,000,628 people shows a moderate positive correlation between the proportion of Pakistanis and labor force participation rate among population between the ages 16 and 19 in the United States with a correlation coefficient (R) of 0.423 and weighted average of 37.6%, a difference of 2.1%.
In Labor Force | Age 16-19 Correlation Summary
| Measurement | Immigrants from Latvia | Pakistani |
| Minimum | 16.4% | 15.4% |
| Maximum | 100.0% | 100.0% |
| Range | 83.6% | 84.6% |
| Mean | 48.7% | 48.1% |
| Median | 42.6% | 40.7% |
| Interquartile 25% (IQ1) | 35.0% | 36.5% |
| Interquartile 75% (IQ3) | 55.3% | 60.0% |
| Interquartile Range (IQR) | 20.3% | 23.5% |
| Standard Deviation (Sample) | 21.4% | 19.2% |
| Standard Deviation (Population) | 21.1% | 19.1% |
Similar Demographics by In Labor Force | Age 16-19
Demographics Similar to Immigrants from Latvia by In Labor Force | Age 16-19
In terms of in labor force | age 16-19, the demographic groups most similar to Immigrants from Latvia are Immigrants from South Africa (36.8%, a difference of 0.060%), Palestinian (36.8%, a difference of 0.080%), Arab (36.8%, a difference of 0.11%), Immigrants from Cambodia (36.7%, a difference of 0.17%), and South African (36.7%, a difference of 0.17%).
| Demographics | Rating | Rank | In Labor Force | Age 16-19 |
| Immigrants | Jordan | 69.5 /100 | #162 | Good 36.9% |
| Bermudans | 69.3 /100 | #163 | Good 36.9% |
| Immigrants | Kuwait | 68.9 /100 | #164 | Good 36.9% |
| Yakama | 66.9 /100 | #165 | Good 36.9% |
| Immigrants | Western Africa | 66.7 /100 | #166 | Good 36.9% |
| Arabs | 63.6 /100 | #167 | Good 36.8% |
| Palestinians | 63.1 /100 | #168 | Good 36.8% |
| Immigrants | Latvia | 61.6 /100 | #169 | Good 36.8% |
| Immigrants | South Africa | 60.5 /100 | #170 | Good 36.8% |
| Immigrants | Cambodia | 58.4 /100 | #171 | Average 36.7% |
| South Africans | 58.3 /100 | #172 | Average 36.7% |
| Russians | 57.5 /100 | #173 | Average 36.7% |
| Immigrants | Czechoslovakia | 50.0 /100 | #174 | Average 36.6% |
| Natives/Alaskans | 49.0 /100 | #175 | Average 36.6% |
| Albanians | 48.8 /100 | #176 | Average 36.5% |
Demographics Similar to Pakistanis by In Labor Force | Age 16-19
In terms of in labor force | age 16-19, the demographic groups most similar to Pakistanis are Japanese (37.5%, a difference of 0.020%), Paiute (37.5%, a difference of 0.020%), Sierra Leonean (37.6%, a difference of 0.030%), Immigrants from Western Europe (37.5%, a difference of 0.070%), and Brazilian (37.5%, a difference of 0.10%).
| Demographics | Rating | Rank | In Labor Force | Age 16-19 |
| Australians | 93.2 /100 | #136 | Exceptional 37.8% |
| Cajuns | 93.2 /100 | #137 | Exceptional 37.8% |
| Comanche | 91.9 /100 | #138 | Exceptional 37.7% |
| Immigrants | Moldova | 91.9 /100 | #139 | Exceptional 37.7% |
| Estonians | 91.7 /100 | #140 | Exceptional 37.7% |
| Syrians | 90.7 /100 | #141 | Exceptional 37.6% |
| Sierra Leoneans | 89.7 /100 | #142 | Excellent 37.6% |
| Pakistanis | 89.5 /100 | #143 | Excellent 37.6% |
| Japanese | 89.3 /100 | #144 | Excellent 37.5% |
| Paiute | 89.3 /100 | #145 | Excellent 37.5% |
| Immigrants | Western Europe | 88.9 /100 | #146 | Excellent 37.5% |
| Brazilians | 88.7 /100 | #147 | Excellent 37.5% |
| Romanians | 87.3 /100 | #148 | Excellent 37.5% |
| Native Hawaiians | 85.0 /100 | #149 | Excellent 37.4% |
| Tsimshian | 84.7 /100 | #150 | Excellent 37.4% |