Immigrants from Turkey vs Immigrants from Latin America In Labor Force | Age 16-19
COMPARE
Immigrants from Turkey
Immigrants from Latin America
In Labor Force | Age 16-19
In Labor Force | Age 16-19 Comparison
Immigrants from Turkey
Immigrants from Latin America
34.9%
IN LABOR FORCE | AGE 16-19
2.6/ 100
METRIC RATING
244th/ 347
METRIC RANK
33.9%
IN LABOR FORCE | AGE 16-19
0.3/ 100
METRIC RATING
276th/ 347
METRIC RANK
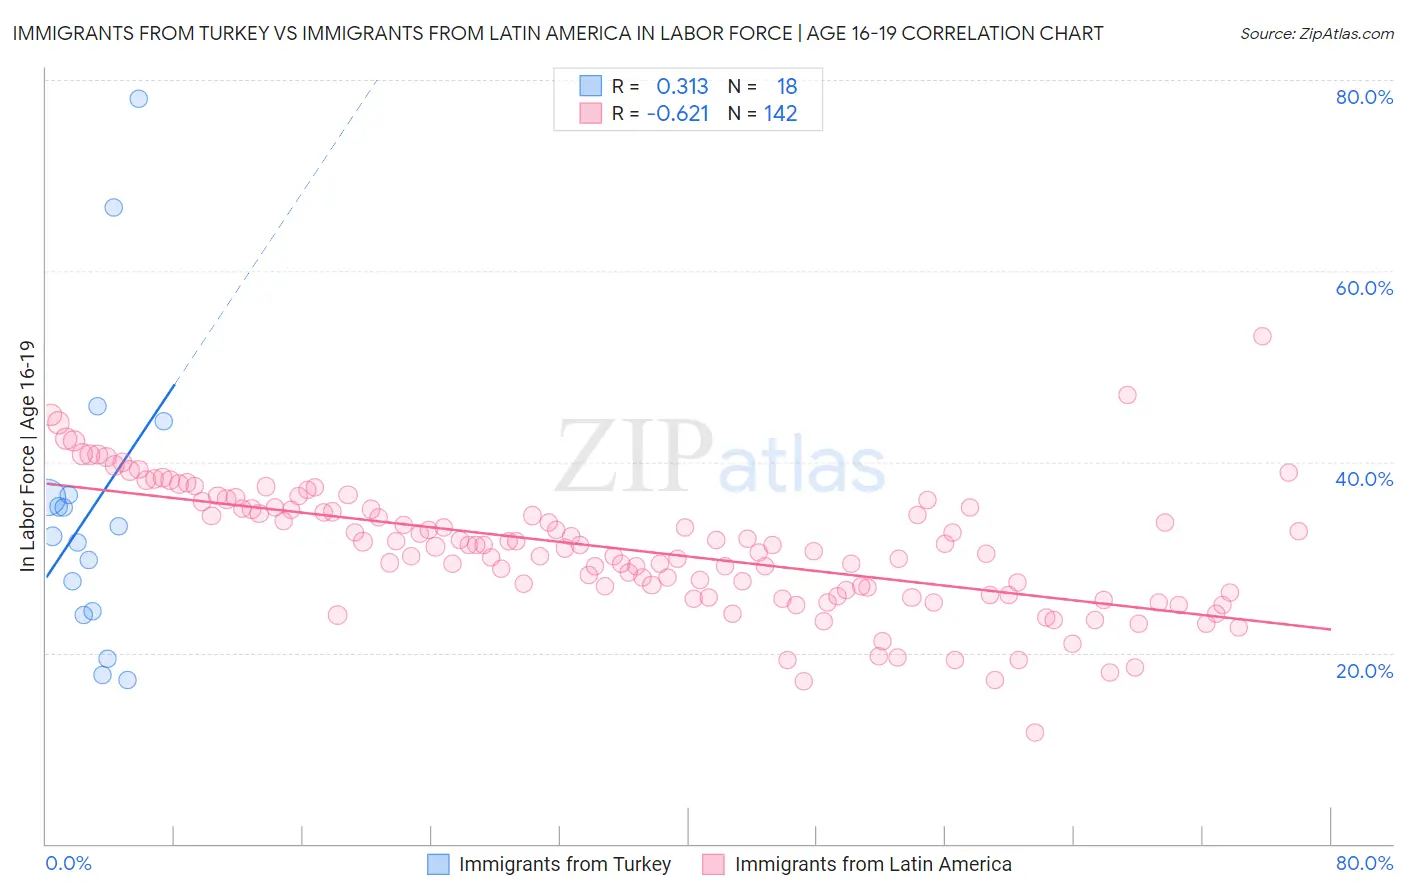
Immigrants from Turkey vs Immigrants from Latin America In Labor Force | Age 16-19 Correlation Chart
The statistical analysis conducted on geographies consisting of 222,808,071 people shows a mild positive correlation between the proportion of Immigrants from Turkey and labor force participation rate among population between the ages 16 and 19 in the United States with a correlation coefficient (R) of 0.313 and weighted average of 34.9%. Similarly, the statistical analysis conducted on geographies consisting of 555,360,667 people shows a significant negative correlation between the proportion of Immigrants from Latin America and labor force participation rate among population between the ages 16 and 19 in the United States with a correlation coefficient (R) of -0.621 and weighted average of 33.9%, a difference of 2.9%.
In Labor Force | Age 16-19 Correlation Summary
| Measurement | Immigrants from Turkey | Immigrants from Latin America |
| Minimum | 17.1% | 11.7% |
| Maximum | 78.1% | 53.1% |
| Range | 61.0% | 41.4% |
| Mean | 35.3% | 30.8% |
| Median | 32.8% | 31.2% |
| Interquartile 25% (IQ1) | 24.3% | 26.1% |
| Interquartile 75% (IQ3) | 36.6% | 35.0% |
| Interquartile Range (IQR) | 12.3% | 8.9% |
| Standard Deviation (Sample) | 15.8% | 6.6% |
| Standard Deviation (Population) | 15.4% | 6.6% |
Similar Demographics by In Labor Force | Age 16-19
Demographics Similar to Immigrants from Turkey by In Labor Force | Age 16-19
In terms of in labor force | age 16-19, the demographic groups most similar to Immigrants from Turkey are Pueblo (34.9%, a difference of 0.020%), Uruguayan (34.9%, a difference of 0.050%), Immigrants from Greece (34.9%, a difference of 0.060%), Immigrants from Sri Lanka (34.9%, a difference of 0.080%), and Laotian (34.9%, a difference of 0.090%).
| Demographics | Rating | Rank | In Labor Force | Age 16-19 |
| Immigrants | India | 3.5 /100 | #237 | Tragic 35.0% |
| Immigrants | Vietnam | 3.4 /100 | #238 | Tragic 35.0% |
| Inupiat | 3.2 /100 | #239 | Tragic 35.0% |
| Immigrants | Central America | 3.0 /100 | #240 | Tragic 35.0% |
| Immigrants | Ireland | 2.9 /100 | #241 | Tragic 35.0% |
| Uruguayans | 2.6 /100 | #242 | Tragic 34.9% |
| Pueblo | 2.6 /100 | #243 | Tragic 34.9% |
| Immigrants | Turkey | 2.6 /100 | #244 | Tragic 34.9% |
| Immigrants | Greece | 2.4 /100 | #245 | Tragic 34.9% |
| Immigrants | Sri Lanka | 2.4 /100 | #246 | Tragic 34.9% |
| Laotians | 2.4 /100 | #247 | Tragic 34.9% |
| Central Americans | 2.2 /100 | #248 | Tragic 34.8% |
| Immigrants | Ukraine | 2.2 /100 | #249 | Tragic 34.8% |
| Immigrants | Pakistan | 2.0 /100 | #250 | Tragic 34.8% |
| Immigrants | Western Asia | 2.0 /100 | #251 | Tragic 34.8% |
Demographics Similar to Immigrants from Latin America by In Labor Force | Age 16-19
In terms of in labor force | age 16-19, the demographic groups most similar to Immigrants from Latin America are Immigrants from Fiji (33.9%, a difference of 0.10%), Menominee (33.9%, a difference of 0.11%), Colombian (33.8%, a difference of 0.18%), Venezuelan (34.0%, a difference of 0.20%), and Paraguayan (33.8%, a difference of 0.20%).
| Demographics | Rating | Rank | In Labor Force | Age 16-19 |
| Pima | 0.5 /100 | #269 | Tragic 34.1% |
| Immigrants | Russia | 0.4 /100 | #270 | Tragic 34.1% |
| Central American Indians | 0.4 /100 | #271 | Tragic 34.1% |
| Asians | 0.4 /100 | #272 | Tragic 34.1% |
| Immigrants | Panama | 0.4 /100 | #273 | Tragic 34.0% |
| Venezuelans | 0.3 /100 | #274 | Tragic 34.0% |
| Immigrants | Fiji | 0.3 /100 | #275 | Tragic 33.9% |
| Immigrants | Latin America | 0.3 /100 | #276 | Tragic 33.9% |
| Menominee | 0.3 /100 | #277 | Tragic 33.9% |
| Colombians | 0.3 /100 | #278 | Tragic 33.8% |
| Paraguayans | 0.3 /100 | #279 | Tragic 33.8% |
| Taiwanese | 0.3 /100 | #280 | Tragic 33.8% |
| Cypriots | 0.3 /100 | #281 | Tragic 33.8% |
| Immigrants | Korea | 0.3 /100 | #282 | Tragic 33.8% |
| Immigrants | Venezuela | 0.2 /100 | #283 | Tragic 33.7% |