Immigrants from Netherlands vs Immigrants from Latin America In Labor Force | Age 16-19
COMPARE
Immigrants from Netherlands
Immigrants from Latin America
In Labor Force | Age 16-19
In Labor Force | Age 16-19 Comparison
Immigrants from Netherlands
Immigrants from Latin America
37.8%
IN LABOR FORCE | AGE 16-19
93.7/ 100
METRIC RATING
134th/ 347
METRIC RANK
33.9%
IN LABOR FORCE | AGE 16-19
0.3/ 100
METRIC RATING
276th/ 347
METRIC RANK
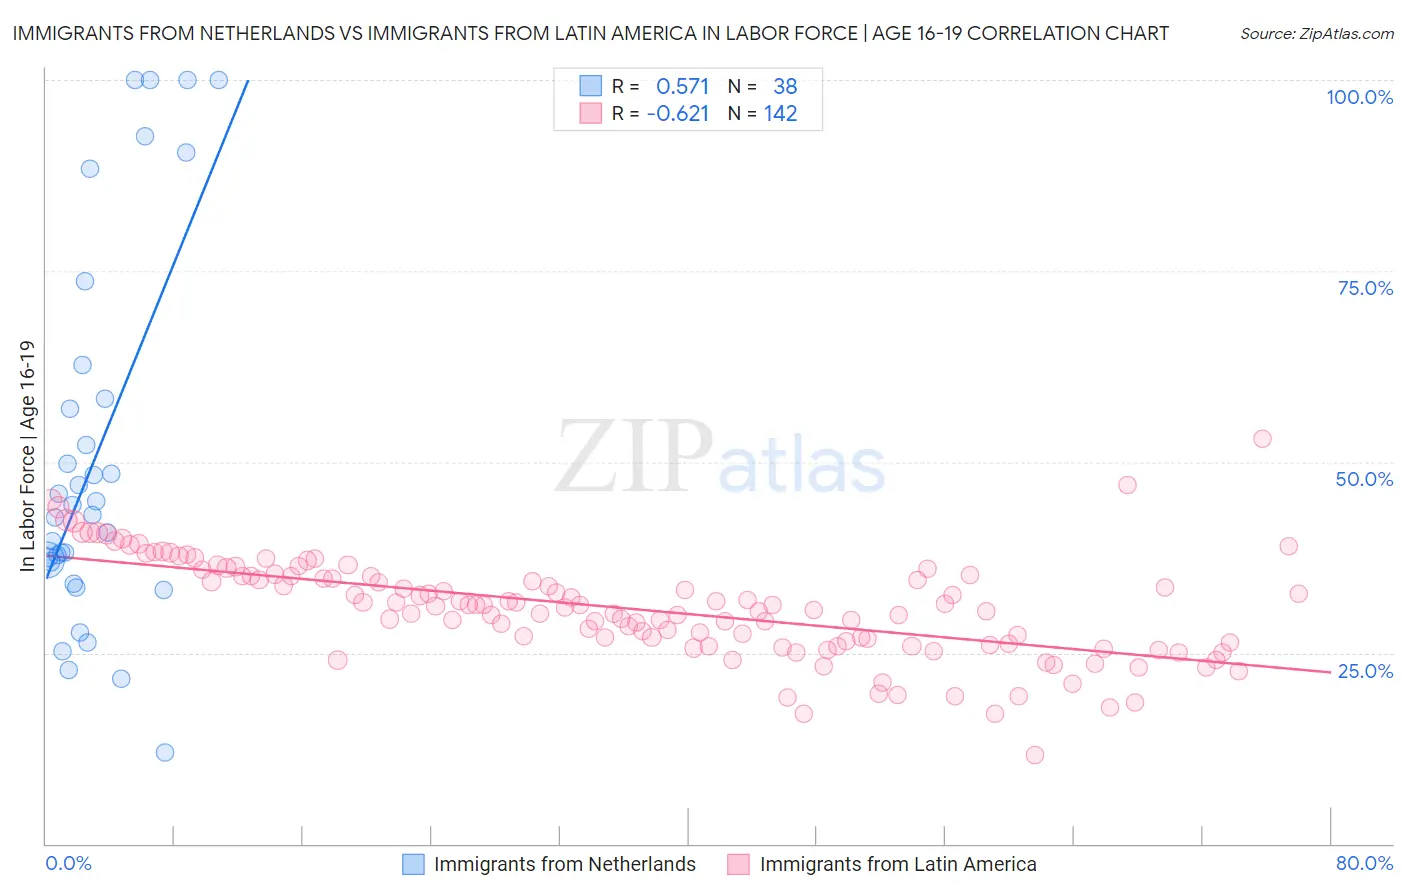
Immigrants from Netherlands vs Immigrants from Latin America In Labor Force | Age 16-19 Correlation Chart
The statistical analysis conducted on geographies consisting of 237,512,378 people shows a substantial positive correlation between the proportion of Immigrants from Netherlands and labor force participation rate among population between the ages 16 and 19 in the United States with a correlation coefficient (R) of 0.571 and weighted average of 37.8%. Similarly, the statistical analysis conducted on geographies consisting of 555,360,667 people shows a significant negative correlation between the proportion of Immigrants from Latin America and labor force participation rate among population between the ages 16 and 19 in the United States with a correlation coefficient (R) of -0.621 and weighted average of 33.9%, a difference of 11.6%.
In Labor Force | Age 16-19 Correlation Summary
| Measurement | Immigrants from Netherlands | Immigrants from Latin America |
| Minimum | 12.0% | 11.7% |
| Maximum | 100.0% | 53.1% |
| Range | 88.0% | 41.4% |
| Mean | 50.8% | 30.8% |
| Median | 43.7% | 31.2% |
| Interquartile 25% (IQ1) | 36.9% | 26.1% |
| Interquartile 75% (IQ3) | 58.3% | 35.0% |
| Interquartile Range (IQR) | 21.4% | 8.9% |
| Standard Deviation (Sample) | 24.7% | 6.6% |
| Standard Deviation (Population) | 24.3% | 6.6% |
Similar Demographics by In Labor Force | Age 16-19
Demographics Similar to Immigrants from Netherlands by In Labor Force | Age 16-19
In terms of in labor force | age 16-19, the demographic groups most similar to Immigrants from Netherlands are Macedonian (37.8%, a difference of 0.060%), Australian (37.8%, a difference of 0.090%), Cajun (37.8%, a difference of 0.090%), Cheyenne (37.9%, a difference of 0.21%), and Immigrants from Oceania (37.9%, a difference of 0.23%).
| Demographics | Rating | Rank | In Labor Force | Age 16-19 |
| Choctaw | 95.6 /100 | #127 | Exceptional 38.0% |
| New Zealanders | 95.6 /100 | #128 | Exceptional 38.0% |
| Spaniards | 95.5 /100 | #129 | Exceptional 38.0% |
| Immigrants | Zimbabwe | 95.4 /100 | #130 | Exceptional 38.0% |
| Immigrants | Austria | 95.0 /100 | #131 | Exceptional 37.9% |
| Immigrants | Oceania | 94.7 /100 | #132 | Exceptional 37.9% |
| Cheyenne | 94.6 /100 | #133 | Exceptional 37.9% |
| Immigrants | Netherlands | 93.7 /100 | #134 | Exceptional 37.8% |
| Macedonians | 93.4 /100 | #135 | Exceptional 37.8% |
| Australians | 93.2 /100 | #136 | Exceptional 37.8% |
| Cajuns | 93.2 /100 | #137 | Exceptional 37.8% |
| Comanche | 91.9 /100 | #138 | Exceptional 37.7% |
| Immigrants | Moldova | 91.9 /100 | #139 | Exceptional 37.7% |
| Estonians | 91.7 /100 | #140 | Exceptional 37.7% |
| Syrians | 90.7 /100 | #141 | Exceptional 37.6% |
Demographics Similar to Immigrants from Latin America by In Labor Force | Age 16-19
In terms of in labor force | age 16-19, the demographic groups most similar to Immigrants from Latin America are Immigrants from Fiji (33.9%, a difference of 0.10%), Menominee (33.9%, a difference of 0.11%), Colombian (33.8%, a difference of 0.18%), Venezuelan (34.0%, a difference of 0.20%), and Paraguayan (33.8%, a difference of 0.20%).
| Demographics | Rating | Rank | In Labor Force | Age 16-19 |
| Pima | 0.5 /100 | #269 | Tragic 34.1% |
| Immigrants | Russia | 0.4 /100 | #270 | Tragic 34.1% |
| Central American Indians | 0.4 /100 | #271 | Tragic 34.1% |
| Asians | 0.4 /100 | #272 | Tragic 34.1% |
| Immigrants | Panama | 0.4 /100 | #273 | Tragic 34.0% |
| Venezuelans | 0.3 /100 | #274 | Tragic 34.0% |
| Immigrants | Fiji | 0.3 /100 | #275 | Tragic 33.9% |
| Immigrants | Latin America | 0.3 /100 | #276 | Tragic 33.9% |
| Menominee | 0.3 /100 | #277 | Tragic 33.9% |
| Colombians | 0.3 /100 | #278 | Tragic 33.8% |
| Paraguayans | 0.3 /100 | #279 | Tragic 33.8% |
| Taiwanese | 0.3 /100 | #280 | Tragic 33.8% |
| Cypriots | 0.3 /100 | #281 | Tragic 33.8% |
| Immigrants | Korea | 0.3 /100 | #282 | Tragic 33.8% |
| Immigrants | Venezuela | 0.2 /100 | #283 | Tragic 33.7% |