Immigrants from Lebanon vs Marshallese In Labor Force | Age 16-19
COMPARE
Immigrants from Lebanon
Marshallese
In Labor Force | Age 16-19
In Labor Force | Age 16-19 Comparison
Immigrants from Lebanon
Marshallese
35.2%
IN LABOR FORCE | AGE 16-19
5.0/ 100
METRIC RATING
229th/ 347
METRIC RANK
39.5%
IN LABOR FORCE | AGE 16-19
99.8/ 100
METRIC RATING
79th/ 347
METRIC RANK
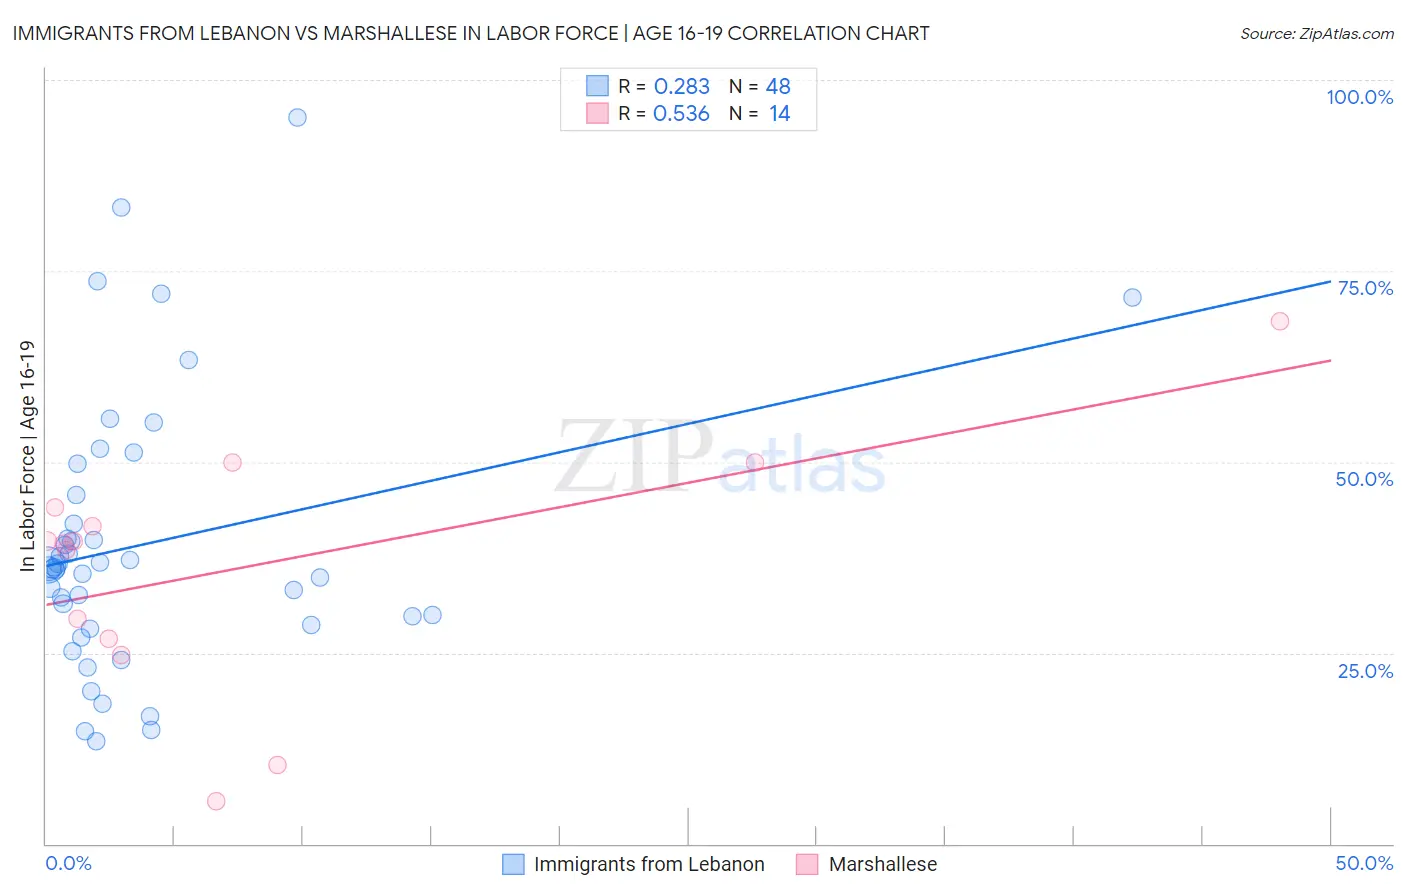
Immigrants from Lebanon vs Marshallese In Labor Force | Age 16-19 Correlation Chart
The statistical analysis conducted on geographies consisting of 217,008,802 people shows a weak positive correlation between the proportion of Immigrants from Lebanon and labor force participation rate among population between the ages 16 and 19 in the United States with a correlation coefficient (R) of 0.283 and weighted average of 35.2%. Similarly, the statistical analysis conducted on geographies consisting of 14,757,218 people shows a substantial positive correlation between the proportion of Marshallese and labor force participation rate among population between the ages 16 and 19 in the United States with a correlation coefficient (R) of 0.536 and weighted average of 39.5%, a difference of 12.1%.
In Labor Force | Age 16-19 Correlation Summary
| Measurement | Immigrants from Lebanon | Marshallese |
| Minimum | 13.4% | 5.6% |
| Maximum | 95.1% | 68.4% |
| Range | 81.7% | 62.8% |
| Mean | 39.2% | 36.3% |
| Median | 36.1% | 39.5% |
| Interquartile 25% (IQ1) | 29.2% | 26.8% |
| Interquartile 75% (IQ3) | 43.8% | 44.1% |
| Interquartile Range (IQR) | 14.6% | 17.3% |
| Standard Deviation (Sample) | 17.7% | 16.2% |
| Standard Deviation (Population) | 17.5% | 15.6% |
Similar Demographics by In Labor Force | Age 16-19
Demographics Similar to Immigrants from Lebanon by In Labor Force | Age 16-19
In terms of in labor force | age 16-19, the demographic groups most similar to Immigrants from Lebanon are Immigrants from Honduras (35.2%, a difference of 0.030%), Immigrants from Senegal (35.3%, a difference of 0.13%), Immigrants from Syria (35.2%, a difference of 0.15%), Immigrants from Kazakhstan (35.2%, a difference of 0.16%), and Mongolian (35.3%, a difference of 0.18%).
| Demographics | Rating | Rank | In Labor Force | Age 16-19 |
| Immigrants | Ghana | 7.3 /100 | #222 | Tragic 35.4% |
| Ghanaians | 6.5 /100 | #223 | Tragic 35.3% |
| Hondurans | 6.5 /100 | #224 | Tragic 35.3% |
| Immigrants | Belgium | 6.1 /100 | #225 | Tragic 35.3% |
| Immigrants | Guatemala | 5.7 /100 | #226 | Tragic 35.3% |
| Mongolians | 5.7 /100 | #227 | Tragic 35.3% |
| Immigrants | Senegal | 5.5 /100 | #228 | Tragic 35.3% |
| Immigrants | Lebanon | 5.0 /100 | #229 | Tragic 35.2% |
| Immigrants | Honduras | 4.9 /100 | #230 | Tragic 35.2% |
| Immigrants | Syria | 4.5 /100 | #231 | Tragic 35.2% |
| Immigrants | Kazakhstan | 4.5 /100 | #232 | Tragic 35.2% |
| Immigrants | France | 4.3 /100 | #233 | Tragic 35.1% |
| Immigrants | Mexico | 4.2 /100 | #234 | Tragic 35.1% |
| Immigrants | Philippines | 4.0 /100 | #235 | Tragic 35.1% |
| Immigrants | Australia | 3.6 /100 | #236 | Tragic 35.1% |
Demographics Similar to Marshallese by In Labor Force | Age 16-19
In terms of in labor force | age 16-19, the demographic groups most similar to Marshallese are Austrian (39.5%, a difference of 0.13%), Immigrants from Iraq (39.4%, a difference of 0.18%), Shoshone (39.3%, a difference of 0.46%), Immigrants from Portugal (39.7%, a difference of 0.52%), and Basque (39.3%, a difference of 0.52%).
| Demographics | Rating | Rank | In Labor Force | Age 16-19 |
| Iroquois | 99.9 /100 | #72 | Exceptional 39.9% |
| Immigrants | Middle Africa | 99.9 /100 | #73 | Exceptional 39.9% |
| Hungarians | 99.9 /100 | #74 | Exceptional 39.8% |
| French American Indians | 99.9 /100 | #75 | Exceptional 39.8% |
| Malaysians | 99.9 /100 | #76 | Exceptional 39.7% |
| Immigrants | Portugal | 99.9 /100 | #77 | Exceptional 39.7% |
| Austrians | 99.8 /100 | #78 | Exceptional 39.5% |
| Marshallese | 99.8 /100 | #79 | Exceptional 39.5% |
| Immigrants | Iraq | 99.8 /100 | #80 | Exceptional 39.4% |
| Shoshone | 99.7 /100 | #81 | Exceptional 39.3% |
| Basques | 99.7 /100 | #82 | Exceptional 39.3% |
| Spanish | 99.7 /100 | #83 | Exceptional 39.3% |
| Immigrants | Uganda | 99.7 /100 | #84 | Exceptional 39.2% |
| Creek | 99.6 /100 | #85 | Exceptional 39.1% |
| Samoans | 99.6 /100 | #86 | Exceptional 39.1% |