Nigerian vs Marshallese In Labor Force | Age 16-19
COMPARE
Nigerian
Marshallese
In Labor Force | Age 16-19
In Labor Force | Age 16-19 Comparison
Nigerians
Marshallese
36.1%
IN LABOR FORCE | AGE 16-19
24.6/ 100
METRIC RATING
194th/ 347
METRIC RANK
39.5%
IN LABOR FORCE | AGE 16-19
99.8/ 100
METRIC RATING
79th/ 347
METRIC RANK
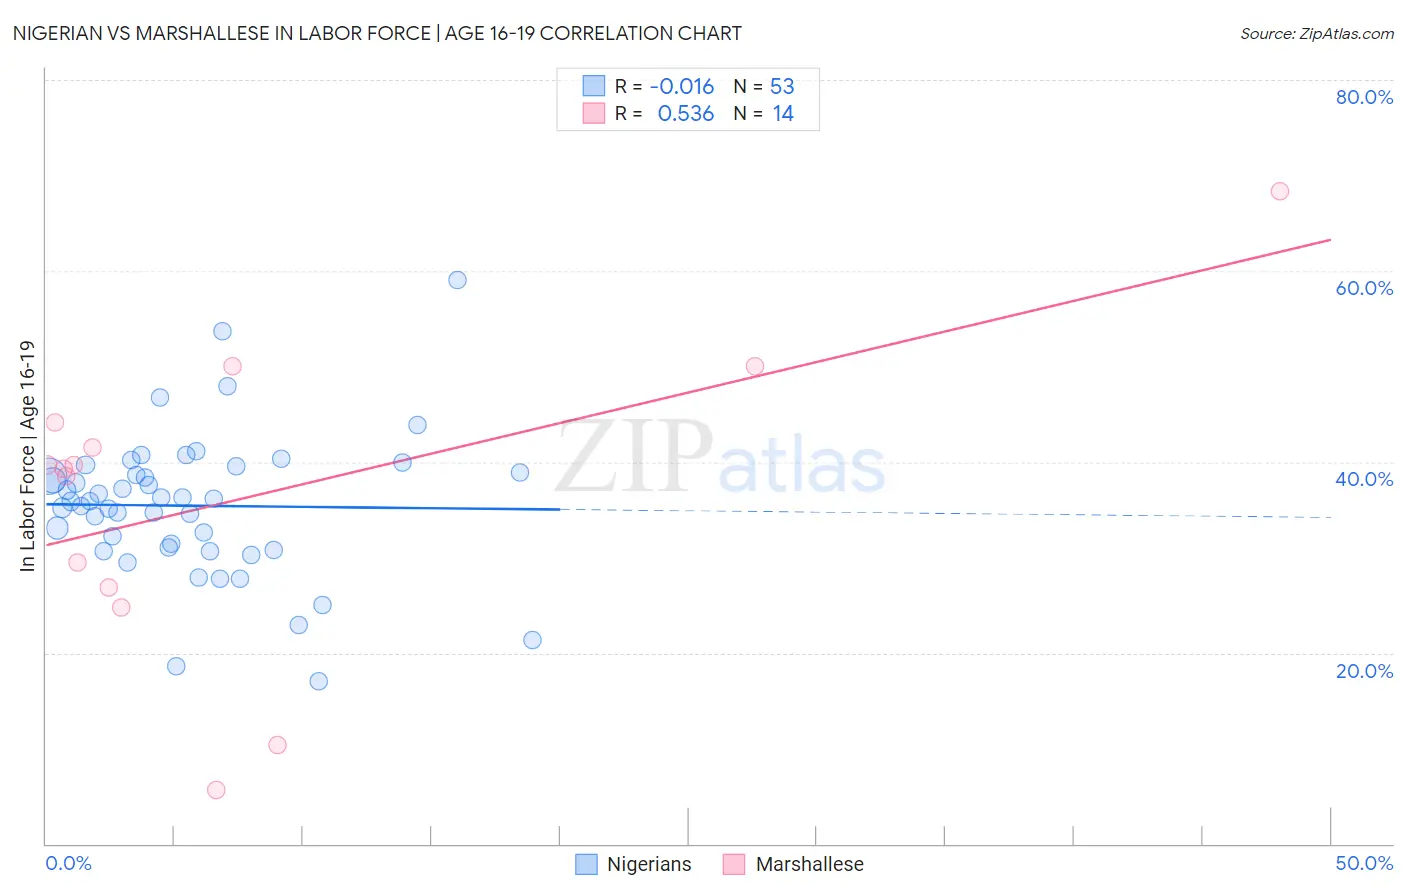
Nigerian vs Marshallese In Labor Force | Age 16-19 Correlation Chart
The statistical analysis conducted on geographies consisting of 332,555,349 people shows no correlation between the proportion of Nigerians and labor force participation rate among population between the ages 16 and 19 in the United States with a correlation coefficient (R) of -0.016 and weighted average of 36.1%. Similarly, the statistical analysis conducted on geographies consisting of 14,757,218 people shows a substantial positive correlation between the proportion of Marshallese and labor force participation rate among population between the ages 16 and 19 in the United States with a correlation coefficient (R) of 0.536 and weighted average of 39.5%, a difference of 9.5%.
In Labor Force | Age 16-19 Correlation Summary
| Measurement | Nigerian | Marshallese |
| Minimum | 17.0% | 5.6% |
| Maximum | 59.1% | 68.4% |
| Range | 42.1% | 62.8% |
| Mean | 35.4% | 36.3% |
| Median | 35.9% | 39.5% |
| Interquartile 25% (IQ1) | 31.0% | 26.8% |
| Interquartile 75% (IQ3) | 39.2% | 44.1% |
| Interquartile Range (IQR) | 8.2% | 17.3% |
| Standard Deviation (Sample) | 7.5% | 16.2% |
| Standard Deviation (Population) | 7.5% | 15.6% |
Similar Demographics by In Labor Force | Age 16-19
Demographics Similar to Nigerians by In Labor Force | Age 16-19
In terms of in labor force | age 16-19, the demographic groups most similar to Nigerians are Immigrants from Denmark (36.1%, a difference of 0.030%), Afghan (36.1%, a difference of 0.070%), Bolivian (36.0%, a difference of 0.090%), Immigrants from Croatia (36.1%, a difference of 0.19%), and Panamanian (36.1%, a difference of 0.26%).
| Demographics | Rating | Rank | In Labor Force | Age 16-19 |
| Immigrants | Afghanistan | 34.0 /100 | #187 | Fair 36.3% |
| Immigrants | Europe | 31.8 /100 | #188 | Fair 36.2% |
| Immigrants | Hungary | 28.8 /100 | #189 | Fair 36.2% |
| Panamanians | 28.6 /100 | #190 | Fair 36.1% |
| Immigrants | Croatia | 27.5 /100 | #191 | Fair 36.1% |
| Afghans | 25.7 /100 | #192 | Fair 36.1% |
| Immigrants | Denmark | 25.0 /100 | #193 | Fair 36.1% |
| Nigerians | 24.6 /100 | #194 | Fair 36.1% |
| Bolivians | 23.3 /100 | #195 | Fair 36.0% |
| Mexican American Indians | 21.1 /100 | #196 | Fair 36.0% |
| Immigrants | Serbia | 21.0 /100 | #197 | Fair 36.0% |
| Immigrants | Northern Africa | 19.9 /100 | #198 | Poor 35.9% |
| Immigrants | Norway | 19.8 /100 | #199 | Poor 35.9% |
| Immigrants | Sweden | 18.8 /100 | #200 | Poor 35.9% |
| Alsatians | 17.5 /100 | #201 | Poor 35.9% |
Demographics Similar to Marshallese by In Labor Force | Age 16-19
In terms of in labor force | age 16-19, the demographic groups most similar to Marshallese are Austrian (39.5%, a difference of 0.13%), Immigrants from Iraq (39.4%, a difference of 0.18%), Shoshone (39.3%, a difference of 0.46%), Immigrants from Portugal (39.7%, a difference of 0.52%), and Basque (39.3%, a difference of 0.52%).
| Demographics | Rating | Rank | In Labor Force | Age 16-19 |
| Iroquois | 99.9 /100 | #72 | Exceptional 39.9% |
| Immigrants | Middle Africa | 99.9 /100 | #73 | Exceptional 39.9% |
| Hungarians | 99.9 /100 | #74 | Exceptional 39.8% |
| French American Indians | 99.9 /100 | #75 | Exceptional 39.8% |
| Malaysians | 99.9 /100 | #76 | Exceptional 39.7% |
| Immigrants | Portugal | 99.9 /100 | #77 | Exceptional 39.7% |
| Austrians | 99.8 /100 | #78 | Exceptional 39.5% |
| Marshallese | 99.8 /100 | #79 | Exceptional 39.5% |
| Immigrants | Iraq | 99.8 /100 | #80 | Exceptional 39.4% |
| Shoshone | 99.7 /100 | #81 | Exceptional 39.3% |
| Basques | 99.7 /100 | #82 | Exceptional 39.3% |
| Spanish | 99.7 /100 | #83 | Exceptional 39.3% |
| Immigrants | Uganda | 99.7 /100 | #84 | Exceptional 39.2% |
| Creek | 99.6 /100 | #85 | Exceptional 39.1% |
| Samoans | 99.6 /100 | #86 | Exceptional 39.1% |