Lebanese vs Marshallese In Labor Force | Age 16-19
COMPARE
Lebanese
Marshallese
In Labor Force | Age 16-19
In Labor Force | Age 16-19 Comparison
Lebanese
Marshallese
38.6%
IN LABOR FORCE | AGE 16-19
98.7/ 100
METRIC RATING
109th/ 347
METRIC RANK
39.5%
IN LABOR FORCE | AGE 16-19
99.8/ 100
METRIC RATING
79th/ 347
METRIC RANK
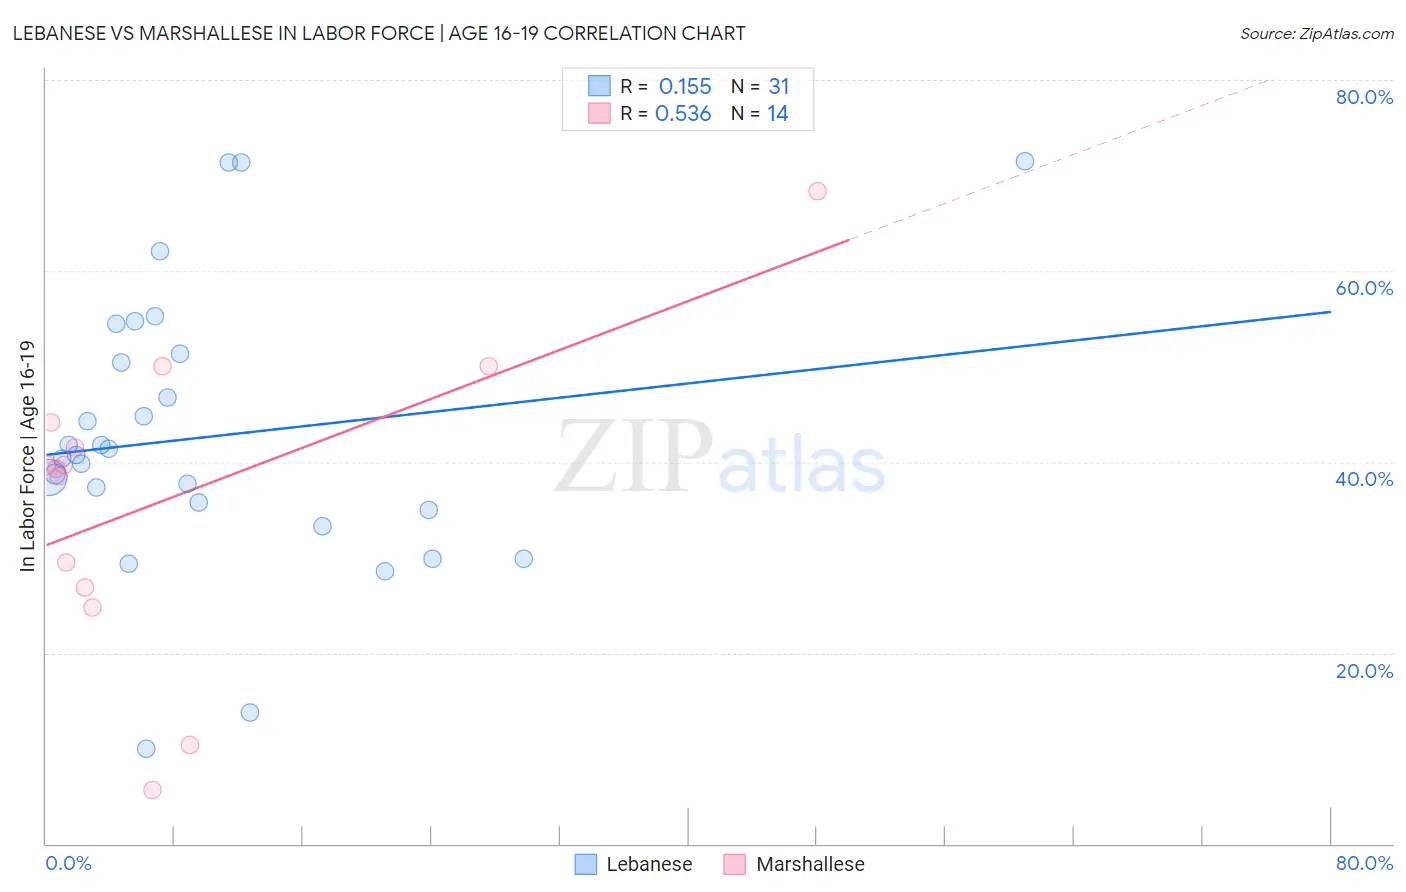
Lebanese vs Marshallese In Labor Force | Age 16-19 Correlation Chart
The statistical analysis conducted on geographies consisting of 401,057,064 people shows a poor positive correlation between the proportion of Lebanese and labor force participation rate among population between the ages 16 and 19 in the United States with a correlation coefficient (R) of 0.155 and weighted average of 38.6%. Similarly, the statistical analysis conducted on geographies consisting of 14,757,218 people shows a substantial positive correlation between the proportion of Marshallese and labor force participation rate among population between the ages 16 and 19 in the United States with a correlation coefficient (R) of 0.536 and weighted average of 39.5%, a difference of 2.3%.
In Labor Force | Age 16-19 Correlation Summary
| Measurement | Lebanese | Marshallese |
| Minimum | 10.0% | 5.6% |
| Maximum | 71.5% | 68.4% |
| Range | 61.5% | 62.8% |
| Mean | 42.6% | 36.3% |
| Median | 40.7% | 39.5% |
| Interquartile 25% (IQ1) | 34.9% | 26.8% |
| Interquartile 75% (IQ3) | 51.3% | 44.1% |
| Interquartile Range (IQR) | 16.4% | 17.3% |
| Standard Deviation (Sample) | 14.6% | 16.2% |
| Standard Deviation (Population) | 14.3% | 15.6% |
Similar Demographics by In Labor Force | Age 16-19
Demographics Similar to Lebanese by In Labor Force | Age 16-19
In terms of in labor force | age 16-19, the demographic groups most similar to Lebanese are Immigrants from Ethiopia (38.6%, a difference of 0.0%), Chinese (38.6%, a difference of 0.10%), Maltese (38.5%, a difference of 0.12%), Delaware (38.6%, a difference of 0.13%), and Iraqi (38.6%, a difference of 0.15%).
| Demographics | Rating | Rank | In Labor Force | Age 16-19 |
| Zimbabweans | 99.1 /100 | #102 | Exceptional 38.7% |
| Immigrants | Cameroon | 99.0 /100 | #103 | Exceptional 38.7% |
| Immigrants | Eritrea | 99.0 /100 | #104 | Exceptional 38.7% |
| Iraqis | 98.9 /100 | #105 | Exceptional 38.6% |
| Delaware | 98.8 /100 | #106 | Exceptional 38.6% |
| Chinese | 98.8 /100 | #107 | Exceptional 38.6% |
| Immigrants | Ethiopia | 98.7 /100 | #108 | Exceptional 38.6% |
| Lebanese | 98.7 /100 | #109 | Exceptional 38.6% |
| Maltese | 98.6 /100 | #110 | Exceptional 38.5% |
| Crow | 98.5 /100 | #111 | Exceptional 38.5% |
| Immigrants | Scotland | 98.5 /100 | #112 | Exceptional 38.5% |
| Sub-Saharan Africans | 98.3 /100 | #113 | Exceptional 38.4% |
| Hawaiians | 98.2 /100 | #114 | Exceptional 38.4% |
| Bulgarians | 97.9 /100 | #115 | Exceptional 38.3% |
| Colville | 97.9 /100 | #116 | Exceptional 38.3% |
Demographics Similar to Marshallese by In Labor Force | Age 16-19
In terms of in labor force | age 16-19, the demographic groups most similar to Marshallese are Austrian (39.5%, a difference of 0.13%), Immigrants from Iraq (39.4%, a difference of 0.18%), Shoshone (39.3%, a difference of 0.46%), Immigrants from Portugal (39.7%, a difference of 0.52%), and Basque (39.3%, a difference of 0.52%).
| Demographics | Rating | Rank | In Labor Force | Age 16-19 |
| Iroquois | 99.9 /100 | #72 | Exceptional 39.9% |
| Immigrants | Middle Africa | 99.9 /100 | #73 | Exceptional 39.9% |
| Hungarians | 99.9 /100 | #74 | Exceptional 39.8% |
| French American Indians | 99.9 /100 | #75 | Exceptional 39.8% |
| Malaysians | 99.9 /100 | #76 | Exceptional 39.7% |
| Immigrants | Portugal | 99.9 /100 | #77 | Exceptional 39.7% |
| Austrians | 99.8 /100 | #78 | Exceptional 39.5% |
| Marshallese | 99.8 /100 | #79 | Exceptional 39.5% |
| Immigrants | Iraq | 99.8 /100 | #80 | Exceptional 39.4% |
| Shoshone | 99.7 /100 | #81 | Exceptional 39.3% |
| Basques | 99.7 /100 | #82 | Exceptional 39.3% |
| Spanish | 99.7 /100 | #83 | Exceptional 39.3% |
| Immigrants | Uganda | 99.7 /100 | #84 | Exceptional 39.2% |
| Creek | 99.6 /100 | #85 | Exceptional 39.1% |
| Samoans | 99.6 /100 | #86 | Exceptional 39.1% |