Immigrants from South Africa vs Moroccan In Labor Force | Age 20-24
COMPARE
Immigrants from South Africa
Moroccan
In Labor Force | Age 20-24
In Labor Force | Age 20-24 Comparison
Immigrants from South Africa
Moroccans
74.9%
IN LABOR FORCE | AGE 20-24
36.9/ 100
METRIC RATING
182nd/ 347
METRIC RANK
74.7%
IN LABOR FORCE | AGE 20-24
20.4/ 100
METRIC RATING
202nd/ 347
METRIC RANK
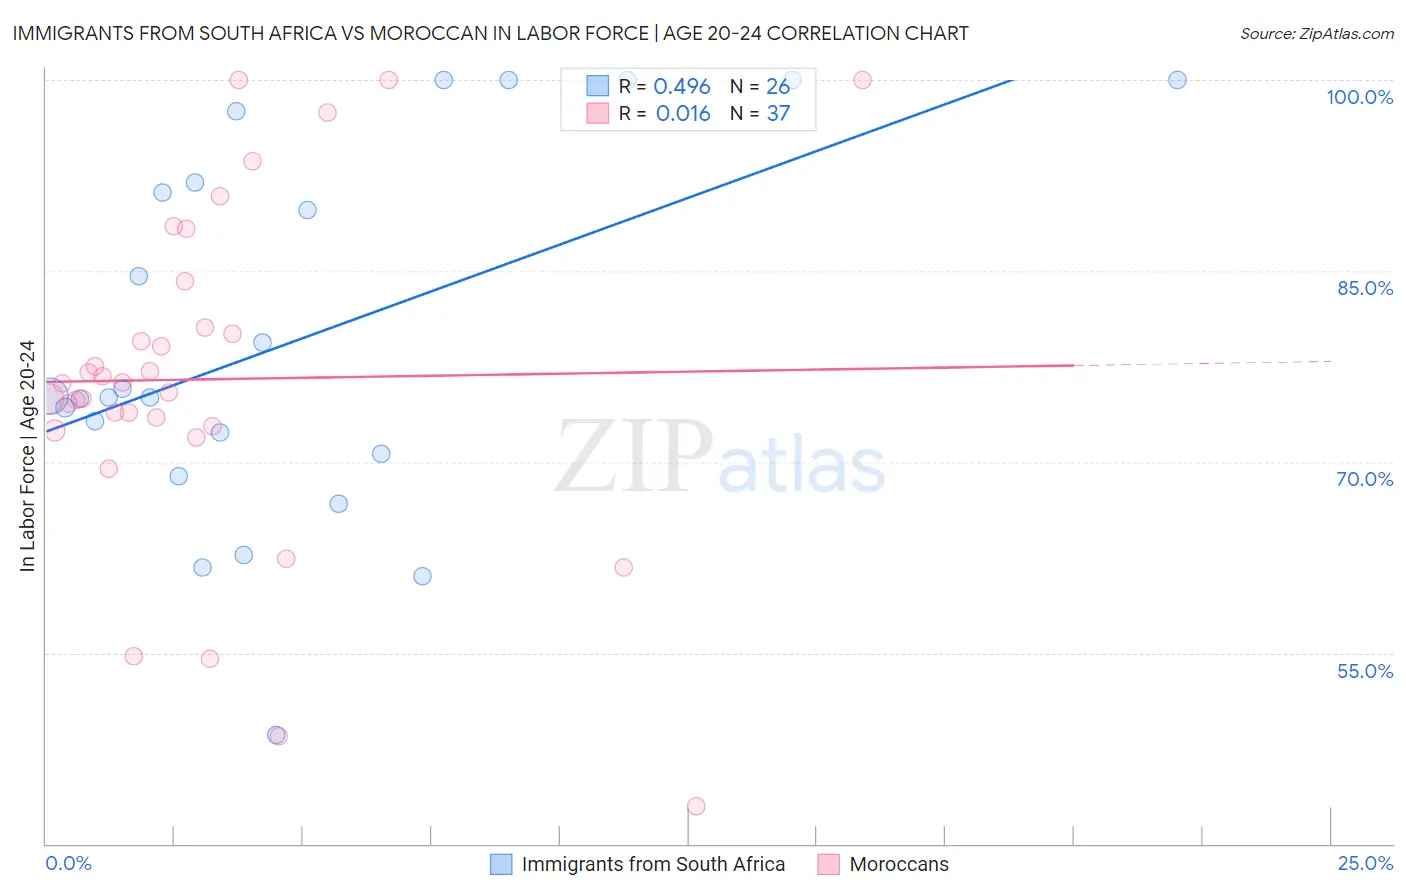
Immigrants from South Africa vs Moroccan In Labor Force | Age 20-24 Correlation Chart
The statistical analysis conducted on geographies consisting of 233,228,799 people shows a moderate positive correlation between the proportion of Immigrants from South Africa and labor force participation rate among population between the ages 20 and 24 in the United States with a correlation coefficient (R) of 0.496 and weighted average of 74.9%. Similarly, the statistical analysis conducted on geographies consisting of 201,764,515 people shows no correlation between the proportion of Moroccans and labor force participation rate among population between the ages 20 and 24 in the United States with a correlation coefficient (R) of 0.016 and weighted average of 74.7%, a difference of 0.30%.
In Labor Force | Age 20-24 Correlation Summary
| Measurement | Immigrants from South Africa | Moroccan |
| Minimum | 48.5% | 42.9% |
| Maximum | 100.0% | 100.0% |
| Range | 51.5% | 57.1% |
| Mean | 79.6% | 76.5% |
| Median | 75.1% | 76.1% |
| Interquartile 25% (IQ1) | 70.6% | 72.6% |
| Interquartile 75% (IQ3) | 92.0% | 82.4% |
| Interquartile Range (IQR) | 21.4% | 9.8% |
| Standard Deviation (Sample) | 14.6% | 13.3% |
| Standard Deviation (Population) | 14.3% | 13.2% |
Demographics Similar to Immigrants from South Africa and Moroccans by In Labor Force | Age 20-24
In terms of in labor force | age 20-24, the demographic groups most similar to Immigrants from South Africa are Immigrants from Costa Rica (74.9%, a difference of 0.0%), Immigrants from Hungary (74.9%, a difference of 0.030%), Sri Lankan (74.9%, a difference of 0.030%), Immigrants from Eastern Europe (74.9%, a difference of 0.050%), and Immigrants from Honduras (74.9%, a difference of 0.060%). Similarly, the demographic groups most similar to Moroccans are Choctaw (74.7%, a difference of 0.020%), Nigerian (74.7%, a difference of 0.030%), Taiwanese (74.7%, a difference of 0.060%), Immigrants from Nigeria (74.7%, a difference of 0.080%), and Eastern European (74.8%, a difference of 0.10%).
| Demographics | Rating | Rank | In Labor Force | Age 20-24 |
| Immigrants | South Africa | 36.9 /100 | #182 | Fair 74.9% |
| Immigrants | Costa Rica | 36.7 /100 | #183 | Fair 74.9% |
| Immigrants | Hungary | 35.0 /100 | #184 | Fair 74.9% |
| Sri Lankans | 34.9 /100 | #185 | Fair 74.9% |
| Immigrants | Eastern Europe | 33.8 /100 | #186 | Fair 74.9% |
| Immigrants | Honduras | 33.5 /100 | #187 | Fair 74.9% |
| Hondurans | 32.7 /100 | #188 | Fair 74.8% |
| Immigrants | Northern Europe | 32.6 /100 | #189 | Fair 74.8% |
| Russians | 32.2 /100 | #190 | Fair 74.8% |
| Senegalese | 28.1 /100 | #191 | Fair 74.8% |
| Immigrants | Europe | 27.5 /100 | #192 | Fair 74.8% |
| Alsatians | 27.1 /100 | #193 | Fair 74.8% |
| Immigrants | Denmark | 25.8 /100 | #194 | Fair 74.8% |
| Eastern Europeans | 25.4 /100 | #195 | Fair 74.8% |
| Immigrants | Vietnam | 25.1 /100 | #196 | Fair 74.7% |
| Panamanians | 25.0 /100 | #197 | Fair 74.7% |
| Immigrants | Nigeria | 24.2 /100 | #198 | Fair 74.7% |
| Taiwanese | 23.2 /100 | #199 | Fair 74.7% |
| Nigerians | 21.9 /100 | #200 | Fair 74.7% |
| Choctaw | 21.4 /100 | #201 | Fair 74.7% |
| Moroccans | 20.4 /100 | #202 | Fair 74.7% |