Norwegian vs Cypriot In Labor Force | Age 20-24
COMPARE
Norwegian
Cypriot
In Labor Force | Age 20-24
In Labor Force | Age 20-24 Comparison
Norwegians
Cypriots
80.1%
IN LABOR FORCE | AGE 20-24
100.0/ 100
METRIC RATING
1st/ 347
METRIC RANK
73.3%
IN LABOR FORCE | AGE 20-24
0.2/ 100
METRIC RATING
278th/ 347
METRIC RANK
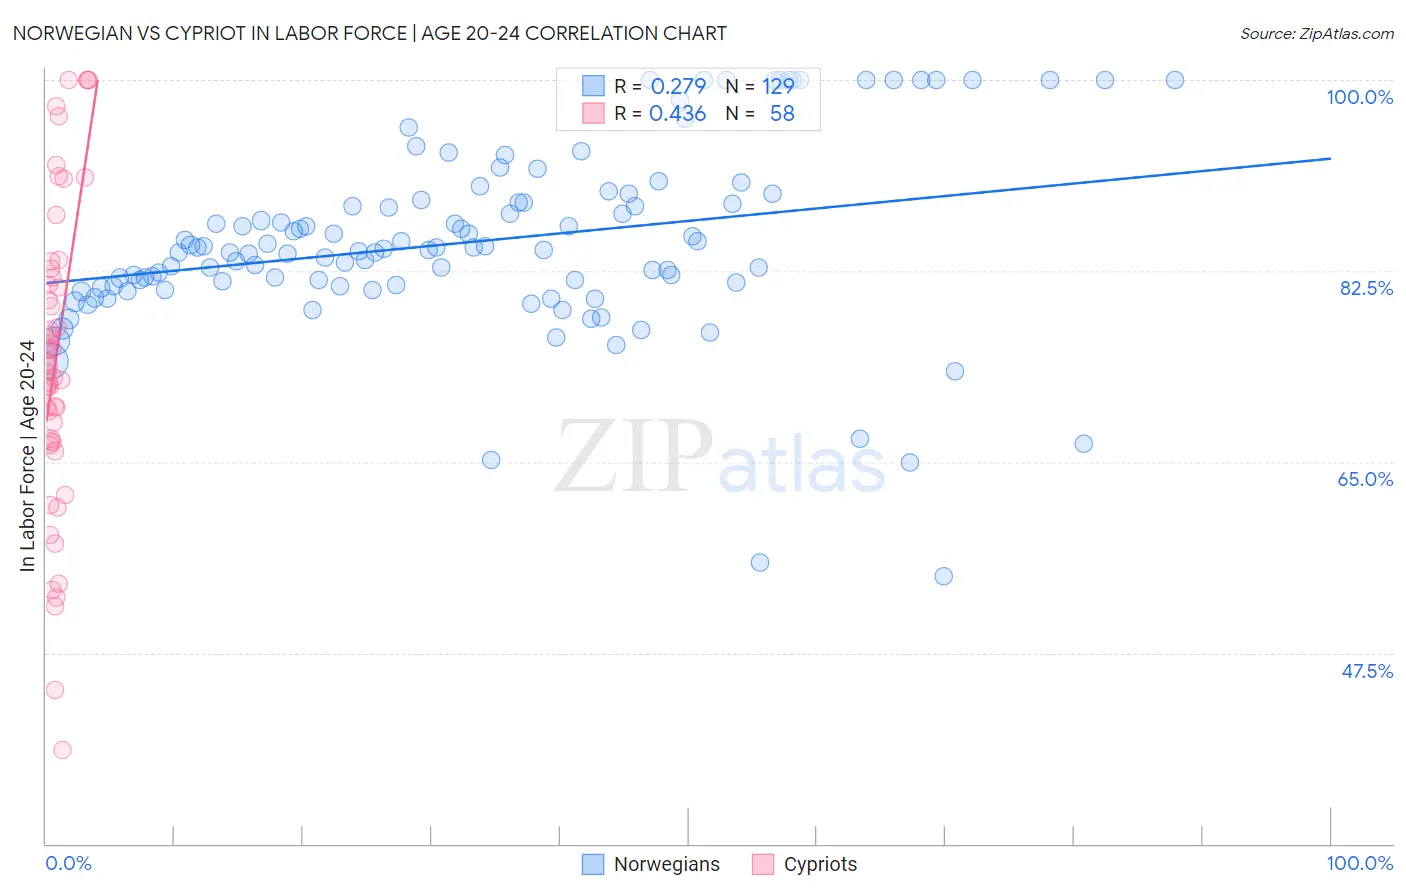
Norwegian vs Cypriot In Labor Force | Age 20-24 Correlation Chart
The statistical analysis conducted on geographies consisting of 532,369,194 people shows a weak positive correlation between the proportion of Norwegians and labor force participation rate among population between the ages 20 and 24 in the United States with a correlation coefficient (R) of 0.279 and weighted average of 80.1%. Similarly, the statistical analysis conducted on geographies consisting of 61,866,486 people shows a moderate positive correlation between the proportion of Cypriots and labor force participation rate among population between the ages 20 and 24 in the United States with a correlation coefficient (R) of 0.436 and weighted average of 73.3%, a difference of 9.3%.
In Labor Force | Age 20-24 Correlation Summary
| Measurement | Norwegian | Cypriot |
| Minimum | 54.5% | 38.6% |
| Maximum | 100.0% | 100.0% |
| Range | 45.5% | 61.4% |
| Mean | 85.2% | 74.4% |
| Median | 84.5% | 73.9% |
| Interquartile 25% (IQ1) | 81.1% | 66.9% |
| Interquartile 75% (IQ3) | 88.9% | 81.9% |
| Interquartile Range (IQR) | 7.8% | 15.0% |
| Standard Deviation (Sample) | 8.5% | 13.9% |
| Standard Deviation (Population) | 8.5% | 13.8% |
Similar Demographics by In Labor Force | Age 20-24
Demographics Similar to Norwegians by In Labor Force | Age 20-24
In terms of in labor force | age 20-24, the demographic groups most similar to Norwegians are Immigrants from Somalia (79.5%, a difference of 0.76%), Somali (79.3%, a difference of 1.1%), Alaskan Athabascan (79.1%, a difference of 1.3%), Aleut (79.0%, a difference of 1.5%), and Danish (79.0%, a difference of 1.5%).
| Demographics | Rating | Rank | In Labor Force | Age 20-24 |
| Norwegians | 100.0 /100 | #1 | Exceptional 80.1% |
| Immigrants | Somalia | 100.0 /100 | #2 | Exceptional 79.5% |
| Somalis | 100.0 /100 | #3 | Exceptional 79.3% |
| Alaskan Athabascans | 100.0 /100 | #4 | Exceptional 79.1% |
| Aleuts | 100.0 /100 | #5 | Exceptional 79.0% |
| Danes | 100.0 /100 | #6 | Exceptional 79.0% |
| Luxembourgers | 100.0 /100 | #7 | Exceptional 79.0% |
| Immigrants | Cabo Verde | 100.0 /100 | #8 | Exceptional 78.9% |
| Swedes | 100.0 /100 | #9 | Exceptional 78.8% |
| Slovenes | 100.0 /100 | #10 | Exceptional 78.7% |
| Finns | 100.0 /100 | #11 | Exceptional 78.7% |
| Germans | 100.0 /100 | #12 | Exceptional 78.6% |
| Scandinavians | 100.0 /100 | #13 | Exceptional 78.5% |
| Czechs | 100.0 /100 | #14 | Exceptional 78.5% |
| Sudanese | 100.0 /100 | #15 | Exceptional 78.4% |
Demographics Similar to Cypriots by In Labor Force | Age 20-24
In terms of in labor force | age 20-24, the demographic groups most similar to Cypriots are Venezuelan (73.3%, a difference of 0.010%), Immigrants from Malaysia (73.3%, a difference of 0.020%), Mongolian (73.3%, a difference of 0.030%), Immigrants from South America (73.3%, a difference of 0.040%), and Bahamian (73.3%, a difference of 0.080%).
| Demographics | Rating | Rank | In Labor Force | Age 20-24 |
| Immigrants | Indonesia | 0.3 /100 | #271 | Tragic 73.4% |
| Belizeans | 0.3 /100 | #272 | Tragic 73.4% |
| Cheyenne | 0.2 /100 | #273 | Tragic 73.4% |
| Immigrants | Colombia | 0.2 /100 | #274 | Tragic 73.4% |
| Immigrants | South America | 0.2 /100 | #275 | Tragic 73.3% |
| Mongolians | 0.2 /100 | #276 | Tragic 73.3% |
| Immigrants | Malaysia | 0.2 /100 | #277 | Tragic 73.3% |
| Cypriots | 0.2 /100 | #278 | Tragic 73.3% |
| Venezuelans | 0.2 /100 | #279 | Tragic 73.3% |
| Bahamians | 0.1 /100 | #280 | Tragic 73.3% |
| Immigrants | Venezuela | 0.1 /100 | #281 | Tragic 73.2% |
| Immigrants | Spain | 0.1 /100 | #282 | Tragic 73.2% |
| Immigrants | Bahamas | 0.1 /100 | #283 | Tragic 73.2% |
| Kiowa | 0.1 /100 | #284 | Tragic 73.2% |
| Nicaraguans | 0.1 /100 | #285 | Tragic 73.2% |