Immigrants from Belize vs Moroccan In Labor Force | Age 20-24
COMPARE
Immigrants from Belize
Moroccan
In Labor Force | Age 20-24
In Labor Force | Age 20-24 Comparison
Immigrants from Belize
Moroccans
72.8%
IN LABOR FORCE | AGE 20-24
0.0/ 100
METRIC RATING
293rd/ 347
METRIC RANK
74.7%
IN LABOR FORCE | AGE 20-24
20.4/ 100
METRIC RATING
202nd/ 347
METRIC RANK
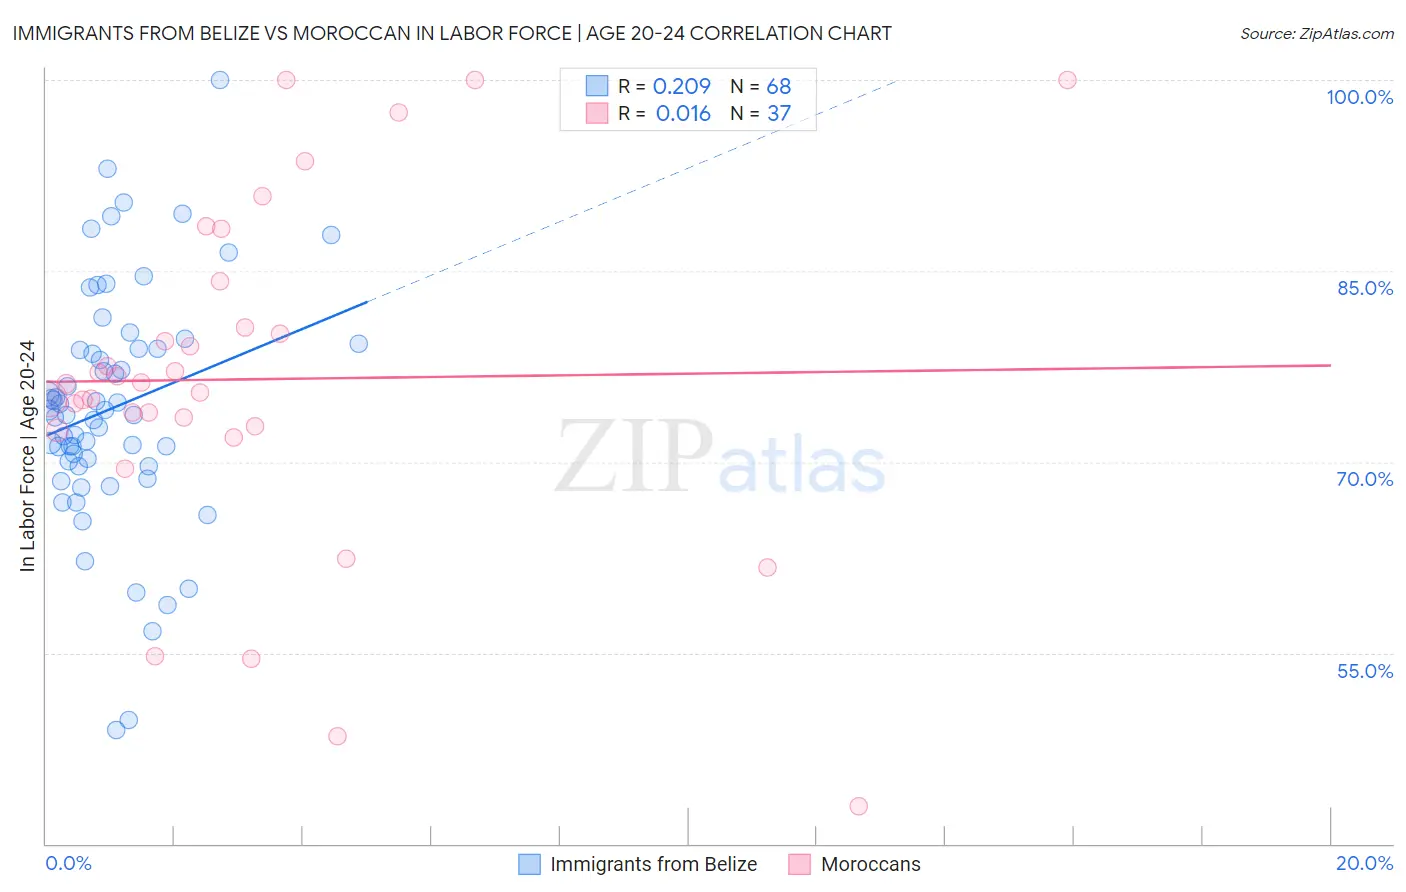
Immigrants from Belize vs Moroccan In Labor Force | Age 20-24 Correlation Chart
The statistical analysis conducted on geographies consisting of 130,312,763 people shows a weak positive correlation between the proportion of Immigrants from Belize and labor force participation rate among population between the ages 20 and 24 in the United States with a correlation coefficient (R) of 0.209 and weighted average of 72.8%. Similarly, the statistical analysis conducted on geographies consisting of 201,764,515 people shows no correlation between the proportion of Moroccans and labor force participation rate among population between the ages 20 and 24 in the United States with a correlation coefficient (R) of 0.016 and weighted average of 74.7%, a difference of 2.5%.
In Labor Force | Age 20-24 Correlation Summary
| Measurement | Immigrants from Belize | Moroccan |
| Minimum | 49.0% | 42.9% |
| Maximum | 100.0% | 100.0% |
| Range | 51.0% | 57.1% |
| Mean | 74.2% | 76.5% |
| Median | 73.9% | 76.1% |
| Interquartile 25% (IQ1) | 69.9% | 72.6% |
| Interquartile 75% (IQ3) | 78.9% | 82.4% |
| Interquartile Range (IQR) | 9.0% | 9.8% |
| Standard Deviation (Sample) | 9.3% | 13.3% |
| Standard Deviation (Population) | 9.3% | 13.2% |
Similar Demographics by In Labor Force | Age 20-24
Demographics Similar to Immigrants from Belize by In Labor Force | Age 20-24
In terms of in labor force | age 20-24, the demographic groups most similar to Immigrants from Belize are Immigrants from Argentina (72.8%, a difference of 0.030%), Pueblo (72.9%, a difference of 0.060%), Okinawan (72.7%, a difference of 0.14%), Jamaican (72.7%, a difference of 0.14%), and Immigrants from Nicaragua (72.9%, a difference of 0.15%).
| Demographics | Rating | Rank | In Labor Force | Age 20-24 |
| Immigrants | Lebanon | 0.1 /100 | #286 | Tragic 73.1% |
| Immigrants | Korea | 0.1 /100 | #287 | Tragic 73.1% |
| Argentineans | 0.1 /100 | #288 | Tragic 73.1% |
| U.S. Virgin Islanders | 0.1 /100 | #289 | Tragic 73.0% |
| Immigrants | Belarus | 0.1 /100 | #290 | Tragic 73.0% |
| Immigrants | Nicaragua | 0.0 /100 | #291 | Tragic 72.9% |
| Pueblo | 0.0 /100 | #292 | Tragic 72.9% |
| Immigrants | Belize | 0.0 /100 | #293 | Tragic 72.8% |
| Immigrants | Argentina | 0.0 /100 | #294 | Tragic 72.8% |
| Okinawans | 0.0 /100 | #295 | Tragic 72.7% |
| Jamaicans | 0.0 /100 | #296 | Tragic 72.7% |
| Central American Indians | 0.0 /100 | #297 | Tragic 72.7% |
| Israelis | 0.0 /100 | #298 | Tragic 72.6% |
| Iranians | 0.0 /100 | #299 | Tragic 72.6% |
| Armenians | 0.0 /100 | #300 | Tragic 72.5% |
Demographics Similar to Moroccans by In Labor Force | Age 20-24
In terms of in labor force | age 20-24, the demographic groups most similar to Moroccans are Choctaw (74.7%, a difference of 0.020%), Nigerian (74.7%, a difference of 0.030%), Taiwanese (74.7%, a difference of 0.060%), Immigrants from Northern Africa (74.6%, a difference of 0.060%), and Immigrants from Italy (74.6%, a difference of 0.070%).
| Demographics | Rating | Rank | In Labor Force | Age 20-24 |
| Eastern Europeans | 25.4 /100 | #195 | Fair 74.8% |
| Immigrants | Vietnam | 25.1 /100 | #196 | Fair 74.7% |
| Panamanians | 25.0 /100 | #197 | Fair 74.7% |
| Immigrants | Nigeria | 24.2 /100 | #198 | Fair 74.7% |
| Taiwanese | 23.2 /100 | #199 | Fair 74.7% |
| Nigerians | 21.9 /100 | #200 | Fair 74.7% |
| Choctaw | 21.4 /100 | #201 | Fair 74.7% |
| Moroccans | 20.4 /100 | #202 | Fair 74.7% |
| Immigrants | Northern Africa | 17.9 /100 | #203 | Poor 74.6% |
| Immigrants | Italy | 17.6 /100 | #204 | Poor 74.6% |
| Inupiat | 17.6 /100 | #205 | Poor 74.6% |
| Sioux | 17.5 /100 | #206 | Poor 74.6% |
| Albanians | 16.2 /100 | #207 | Poor 74.6% |
| Immigrants | Uruguay | 15.8 /100 | #208 | Poor 74.6% |
| Arabs | 15.8 /100 | #209 | Poor 74.6% |