Norwegian vs Native/Alaskan In Labor Force | Age 20-24
COMPARE
Norwegian
Native/Alaskan
In Labor Force | Age 20-24
In Labor Force | Age 20-24 Comparison
Norwegians
Natives/Alaskans
80.1%
IN LABOR FORCE | AGE 20-24
100.0/ 100
METRIC RATING
1st/ 347
METRIC RANK
72.4%
IN LABOR FORCE | AGE 20-24
0.0/ 100
METRIC RATING
302nd/ 347
METRIC RANK
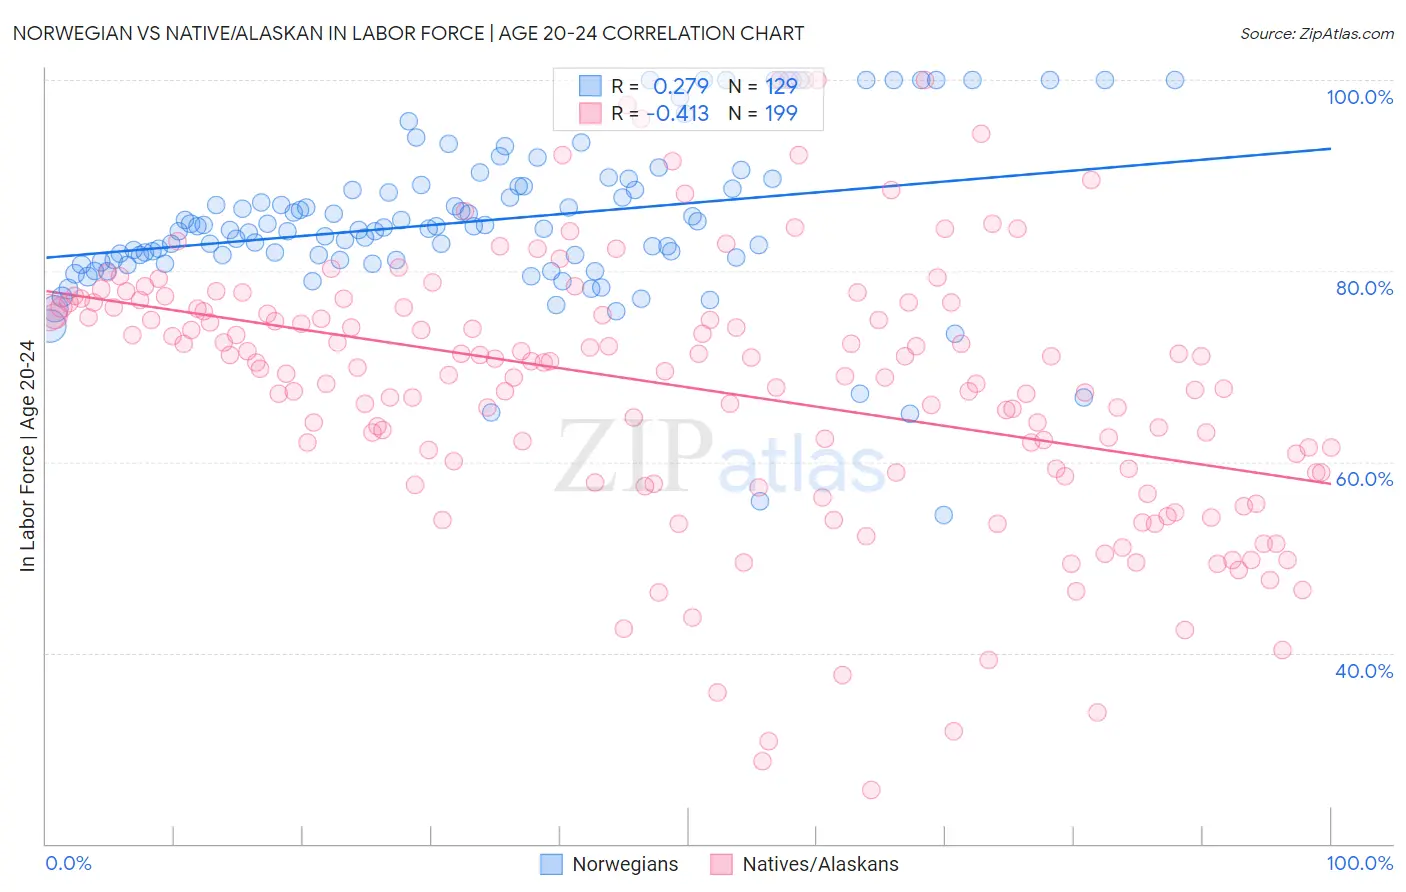
Norwegian vs Native/Alaskan In Labor Force | Age 20-24 Correlation Chart
The statistical analysis conducted on geographies consisting of 532,369,194 people shows a weak positive correlation between the proportion of Norwegians and labor force participation rate among population between the ages 20 and 24 in the United States with a correlation coefficient (R) of 0.279 and weighted average of 80.1%. Similarly, the statistical analysis conducted on geographies consisting of 512,418,491 people shows a moderate negative correlation between the proportion of Natives/Alaskans and labor force participation rate among population between the ages 20 and 24 in the United States with a correlation coefficient (R) of -0.413 and weighted average of 72.4%, a difference of 10.7%.
In Labor Force | Age 20-24 Correlation Summary
| Measurement | Norwegian | Native/Alaskan |
| Minimum | 54.5% | 25.7% |
| Maximum | 100.0% | 100.0% |
| Range | 45.5% | 74.3% |
| Mean | 85.2% | 67.8% |
| Median | 84.5% | 69.8% |
| Interquartile 25% (IQ1) | 81.1% | 58.9% |
| Interquartile 75% (IQ3) | 88.9% | 76.2% |
| Interquartile Range (IQR) | 7.8% | 17.3% |
| Standard Deviation (Sample) | 8.5% | 14.2% |
| Standard Deviation (Population) | 8.5% | 14.2% |
Similar Demographics by In Labor Force | Age 20-24
Demographics Similar to Norwegians by In Labor Force | Age 20-24
In terms of in labor force | age 20-24, the demographic groups most similar to Norwegians are Immigrants from Somalia (79.5%, a difference of 0.76%), Somali (79.3%, a difference of 1.1%), Alaskan Athabascan (79.1%, a difference of 1.3%), Aleut (79.0%, a difference of 1.5%), and Danish (79.0%, a difference of 1.5%).
| Demographics | Rating | Rank | In Labor Force | Age 20-24 |
| Norwegians | 100.0 /100 | #1 | Exceptional 80.1% |
| Immigrants | Somalia | 100.0 /100 | #2 | Exceptional 79.5% |
| Somalis | 100.0 /100 | #3 | Exceptional 79.3% |
| Alaskan Athabascans | 100.0 /100 | #4 | Exceptional 79.1% |
| Aleuts | 100.0 /100 | #5 | Exceptional 79.0% |
| Danes | 100.0 /100 | #6 | Exceptional 79.0% |
| Luxembourgers | 100.0 /100 | #7 | Exceptional 79.0% |
| Immigrants | Cabo Verde | 100.0 /100 | #8 | Exceptional 78.9% |
| Swedes | 100.0 /100 | #9 | Exceptional 78.8% |
| Slovenes | 100.0 /100 | #10 | Exceptional 78.7% |
| Finns | 100.0 /100 | #11 | Exceptional 78.7% |
| Germans | 100.0 /100 | #12 | Exceptional 78.6% |
| Scandinavians | 100.0 /100 | #13 | Exceptional 78.5% |
| Czechs | 100.0 /100 | #14 | Exceptional 78.5% |
| Sudanese | 100.0 /100 | #15 | Exceptional 78.4% |
Demographics Similar to Natives/Alaskans by In Labor Force | Age 20-24
In terms of in labor force | age 20-24, the demographic groups most similar to Natives/Alaskans are Ecuadorian (72.4%, a difference of 0.010%), Immigrants from West Indies (72.4%, a difference of 0.020%), Immigrants from Singapore (72.4%, a difference of 0.050%), Immigrants from Jamaica (72.4%, a difference of 0.070%), and Cuban (72.5%, a difference of 0.090%).
| Demographics | Rating | Rank | In Labor Force | Age 20-24 |
| Okinawans | 0.0 /100 | #295 | Tragic 72.7% |
| Jamaicans | 0.0 /100 | #296 | Tragic 72.7% |
| Central American Indians | 0.0 /100 | #297 | Tragic 72.7% |
| Israelis | 0.0 /100 | #298 | Tragic 72.6% |
| Iranians | 0.0 /100 | #299 | Tragic 72.6% |
| Armenians | 0.0 /100 | #300 | Tragic 72.5% |
| Cubans | 0.0 /100 | #301 | Tragic 72.5% |
| Natives/Alaskans | 0.0 /100 | #302 | Tragic 72.4% |
| Ecuadorians | 0.0 /100 | #303 | Tragic 72.4% |
| Immigrants | West Indies | 0.0 /100 | #304 | Tragic 72.4% |
| Immigrants | Singapore | 0.0 /100 | #305 | Tragic 72.4% |
| Immigrants | Jamaica | 0.0 /100 | #306 | Tragic 72.4% |
| Immigrants | Ecuador | 0.0 /100 | #307 | Tragic 72.3% |
| Soviet Union | 0.0 /100 | #308 | Tragic 72.3% |
| Tsimshian | 0.0 /100 | #309 | Tragic 72.3% |