Nonimmigrants vs Serbian In Labor Force | Age 35-44
COMPARE
Nonimmigrants
Serbian
In Labor Force | Age 35-44
In Labor Force | Age 35-44 Comparison
Nonimmigrants
Serbians
83.2%
IN LABOR FORCE | AGE 35-44
0.0/ 100
METRIC RATING
274th/ 347
METRIC RANK
85.1%
IN LABOR FORCE | AGE 35-44
99.4/ 100
METRIC RATING
59th/ 347
METRIC RANK
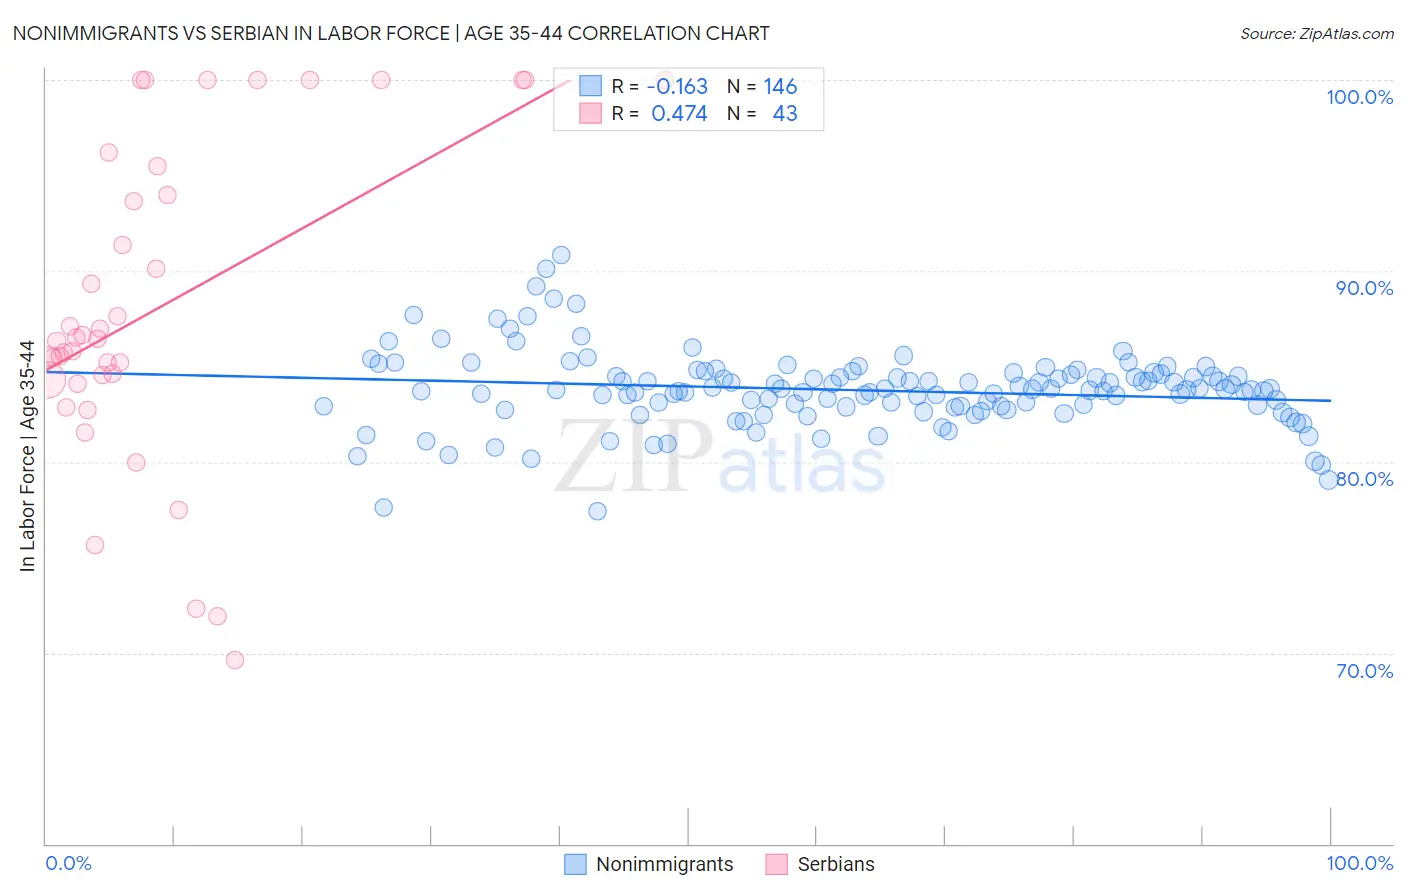
Nonimmigrants vs Serbian In Labor Force | Age 35-44 Correlation Chart
The statistical analysis conducted on geographies consisting of 584,065,526 people shows a poor negative correlation between the proportion of Nonimmigrants and labor force participation rate among population between the ages 35 and 44 in the United States with a correlation coefficient (R) of -0.163 and weighted average of 83.2%. Similarly, the statistical analysis conducted on geographies consisting of 267,549,100 people shows a moderate positive correlation between the proportion of Serbians and labor force participation rate among population between the ages 35 and 44 in the United States with a correlation coefficient (R) of 0.474 and weighted average of 85.1%, a difference of 2.2%.
In Labor Force | Age 35-44 Correlation Summary
| Measurement | Nonimmigrants | Serbian |
| Minimum | 77.4% | 69.6% |
| Maximum | 90.8% | 100.0% |
| Range | 13.4% | 30.4% |
| Mean | 83.8% | 88.1% |
| Median | 83.8% | 86.4% |
| Interquartile 25% (IQ1) | 82.9% | 84.3% |
| Interquartile 75% (IQ3) | 84.6% | 95.5% |
| Interquartile Range (IQR) | 1.7% | 11.2% |
| Standard Deviation (Sample) | 2.0% | 8.3% |
| Standard Deviation (Population) | 2.0% | 8.2% |
Similar Demographics by In Labor Force | Age 35-44
Demographics Similar to Nonimmigrants by In Labor Force | Age 35-44
In terms of in labor force | age 35-44, the demographic groups most similar to Nonimmigrants are Immigrants from Fiji (83.2%, a difference of 0.020%), Spanish (83.2%, a difference of 0.020%), Hawaiian (83.2%, a difference of 0.020%), Delaware (83.2%, a difference of 0.030%), and Samoan (83.2%, a difference of 0.030%).
| Demographics | Rating | Rank | In Labor Force | Age 35-44 |
| Guamanians/Chamorros | 0.1 /100 | #267 | Tragic 83.4% |
| Hondurans | 0.1 /100 | #268 | Tragic 83.4% |
| Immigrants | Grenada | 0.1 /100 | #269 | Tragic 83.3% |
| Immigrants | Honduras | 0.0 /100 | #270 | Tragic 83.3% |
| French American Indians | 0.0 /100 | #271 | Tragic 83.2% |
| Immigrants | Fiji | 0.0 /100 | #272 | Tragic 83.2% |
| Spanish | 0.0 /100 | #273 | Tragic 83.2% |
| Immigrants | Nonimmigrants | 0.0 /100 | #274 | Tragic 83.2% |
| Hawaiians | 0.0 /100 | #275 | Tragic 83.2% |
| Delaware | 0.0 /100 | #276 | Tragic 83.2% |
| Samoans | 0.0 /100 | #277 | Tragic 83.2% |
| Belizeans | 0.0 /100 | #278 | Tragic 83.1% |
| Immigrants | Micronesia | 0.0 /100 | #279 | Tragic 83.1% |
| Dominicans | 0.0 /100 | #280 | Tragic 83.1% |
| Guatemalans | 0.0 /100 | #281 | Tragic 83.0% |
Demographics Similar to Serbians by In Labor Force | Age 35-44
In terms of in labor force | age 35-44, the demographic groups most similar to Serbians are Slovak (85.1%, a difference of 0.0%), Albanian (85.1%, a difference of 0.0%), Chinese (85.1%, a difference of 0.010%), Immigrants from Croatia (85.1%, a difference of 0.020%), and Immigrants from Latvia (85.0%, a difference of 0.020%).
| Demographics | Rating | Rank | In Labor Force | Age 35-44 |
| Immigrants | Kenya | 99.6 /100 | #52 | Exceptional 85.1% |
| Taiwanese | 99.6 /100 | #53 | Exceptional 85.1% |
| Turks | 99.5 /100 | #54 | Exceptional 85.1% |
| Soviet Union | 99.5 /100 | #55 | Exceptional 85.1% |
| Immigrants | Croatia | 99.5 /100 | #56 | Exceptional 85.1% |
| Chinese | 99.4 /100 | #57 | Exceptional 85.1% |
| Slovaks | 99.4 /100 | #58 | Exceptional 85.1% |
| Serbians | 99.4 /100 | #59 | Exceptional 85.1% |
| Albanians | 99.4 /100 | #60 | Exceptional 85.1% |
| Immigrants | Latvia | 99.3 /100 | #61 | Exceptional 85.0% |
| Immigrants | Moldova | 99.3 /100 | #62 | Exceptional 85.0% |
| Immigrants | Uganda | 99.3 /100 | #63 | Exceptional 85.0% |
| Swedes | 99.2 /100 | #64 | Exceptional 85.0% |
| Immigrants | Brazil | 99.2 /100 | #65 | Exceptional 85.0% |
| Immigrants | Haiti | 99.1 /100 | #66 | Exceptional 85.0% |