Immigrants from Oceania vs Central American In Labor Force | Age 25-29
COMPARE
Immigrants from Oceania
Central American
In Labor Force | Age 25-29
In Labor Force | Age 25-29 Comparison
Immigrants from Oceania
Central Americans
84.2%
IN LABOR FORCE | AGE 25-29
5.0/ 100
METRIC RATING
229th/ 347
METRIC RANK
83.7%
IN LABOR FORCE | AGE 25-29
0.2/ 100
METRIC RATING
250th/ 347
METRIC RANK
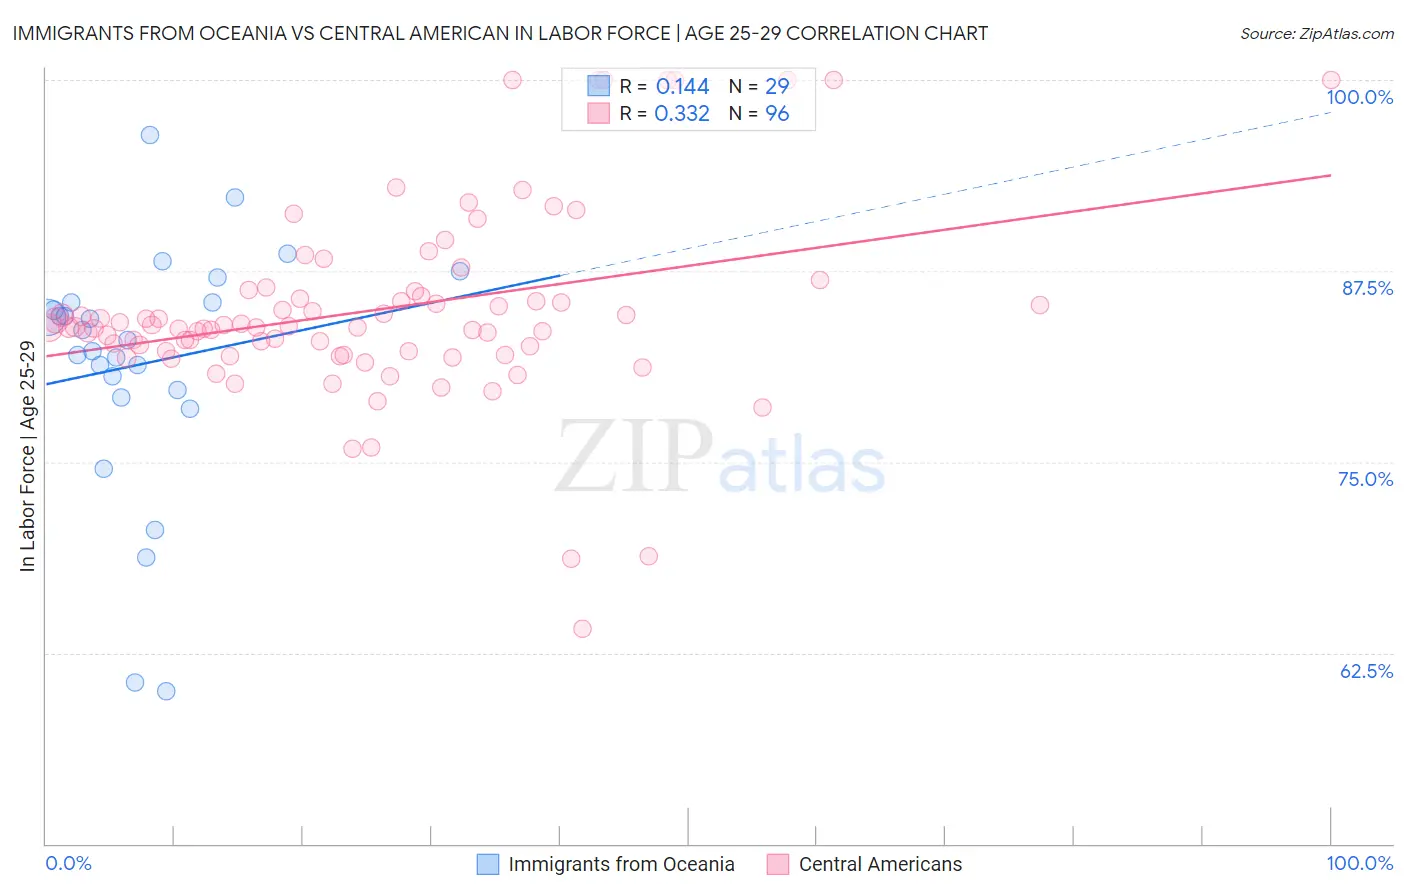
Immigrants from Oceania vs Central American In Labor Force | Age 25-29 Correlation Chart
The statistical analysis conducted on geographies consisting of 305,432,144 people shows a poor positive correlation between the proportion of Immigrants from Oceania and labor force participation rate among population between the ages 25 and 29 in the United States with a correlation coefficient (R) of 0.144 and weighted average of 84.2%. Similarly, the statistical analysis conducted on geographies consisting of 504,238,703 people shows a mild positive correlation between the proportion of Central Americans and labor force participation rate among population between the ages 25 and 29 in the United States with a correlation coefficient (R) of 0.332 and weighted average of 83.7%, a difference of 0.58%.
In Labor Force | Age 25-29 Correlation Summary
| Measurement | Immigrants from Oceania | Central American |
| Minimum | 60.0% | 64.1% |
| Maximum | 96.4% | 100.0% |
| Range | 36.4% | 35.9% |
| Mean | 81.4% | 84.9% |
| Median | 83.0% | 83.8% |
| Interquartile 25% (IQ1) | 79.5% | 82.2% |
| Interquartile 75% (IQ3) | 85.4% | 86.0% |
| Interquartile Range (IQR) | 6.0% | 3.7% |
| Standard Deviation (Sample) | 8.1% | 6.3% |
| Standard Deviation (Population) | 8.0% | 6.3% |
Similar Demographics by In Labor Force | Age 25-29
Demographics Similar to Immigrants from Oceania by In Labor Force | Age 25-29
In terms of in labor force | age 25-29, the demographic groups most similar to Immigrants from Oceania are White/Caucasian (84.2%, a difference of 0.0%), Immigrants from Philippines (84.2%, a difference of 0.010%), French American Indian (84.2%, a difference of 0.020%), Immigrants from Panama (84.2%, a difference of 0.020%), and Panamanian (84.2%, a difference of 0.020%).
| Demographics | Rating | Rank | In Labor Force | Age 25-29 |
| Jordanians | 6.7 /100 | #222 | Tragic 84.2% |
| Scotch-Irish | 6.5 /100 | #223 | Tragic 84.2% |
| Immigrants | West Indies | 6.0 /100 | #224 | Tragic 84.2% |
| Koreans | 5.9 /100 | #225 | Tragic 84.2% |
| Immigrants | Congo | 5.8 /100 | #226 | Tragic 84.2% |
| French American Indians | 5.5 /100 | #227 | Tragic 84.2% |
| Immigrants | Panama | 5.5 /100 | #228 | Tragic 84.2% |
| Immigrants | Oceania | 5.0 /100 | #229 | Tragic 84.2% |
| Whites/Caucasians | 4.8 /100 | #230 | Tragic 84.2% |
| Immigrants | Philippines | 4.7 /100 | #231 | Tragic 84.2% |
| Panamanians | 4.5 /100 | #232 | Tragic 84.2% |
| Immigrants | Western Asia | 2.7 /100 | #233 | Tragic 84.1% |
| Barbadians | 1.0 /100 | #234 | Tragic 83.9% |
| Iraqis | 0.9 /100 | #235 | Tragic 83.9% |
| Guamanians/Chamorros | 0.9 /100 | #236 | Tragic 83.9% |
Demographics Similar to Central Americans by In Labor Force | Age 25-29
In terms of in labor force | age 25-29, the demographic groups most similar to Central Americans are Hmong (83.7%, a difference of 0.020%), Bahamian (83.7%, a difference of 0.020%), Guatemalan (83.7%, a difference of 0.020%), Nonimmigrants (83.7%, a difference of 0.030%), and Immigrants from Trinidad and Tobago (83.7%, a difference of 0.030%).
| Demographics | Rating | Rank | In Labor Force | Age 25-29 |
| Salvadorans | 0.5 /100 | #243 | Tragic 83.8% |
| Immigrants | Jamaica | 0.4 /100 | #244 | Tragic 83.8% |
| Iroquois | 0.4 /100 | #245 | Tragic 83.8% |
| Cree | 0.3 /100 | #246 | Tragic 83.8% |
| Immigrants | El Salvador | 0.3 /100 | #247 | Tragic 83.7% |
| Immigrants | Nonimmigrants | 0.3 /100 | #248 | Tragic 83.7% |
| Hmong | 0.3 /100 | #249 | Tragic 83.7% |
| Central Americans | 0.2 /100 | #250 | Tragic 83.7% |
| Bahamians | 0.2 /100 | #251 | Tragic 83.7% |
| Guatemalans | 0.2 /100 | #252 | Tragic 83.7% |
| Immigrants | Trinidad and Tobago | 0.2 /100 | #253 | Tragic 83.7% |
| Spaniards | 0.2 /100 | #254 | Tragic 83.7% |
| Haitians | 0.2 /100 | #255 | Tragic 83.7% |
| Immigrants | Haiti | 0.2 /100 | #256 | Tragic 83.7% |
| Delaware | 0.2 /100 | #257 | Tragic 83.7% |