Nigerian vs Immigrants from Romania In Labor Force | Age 16-19
COMPARE
Nigerian
Immigrants from Romania
In Labor Force | Age 16-19
In Labor Force | Age 16-19 Comparison
Nigerians
Immigrants from Romania
36.1%
IN LABOR FORCE | AGE 16-19
24.6/ 100
METRIC RATING
194th/ 347
METRIC RANK
36.3%
IN LABOR FORCE | AGE 16-19
34.0/ 100
METRIC RATING
186th/ 347
METRIC RANK
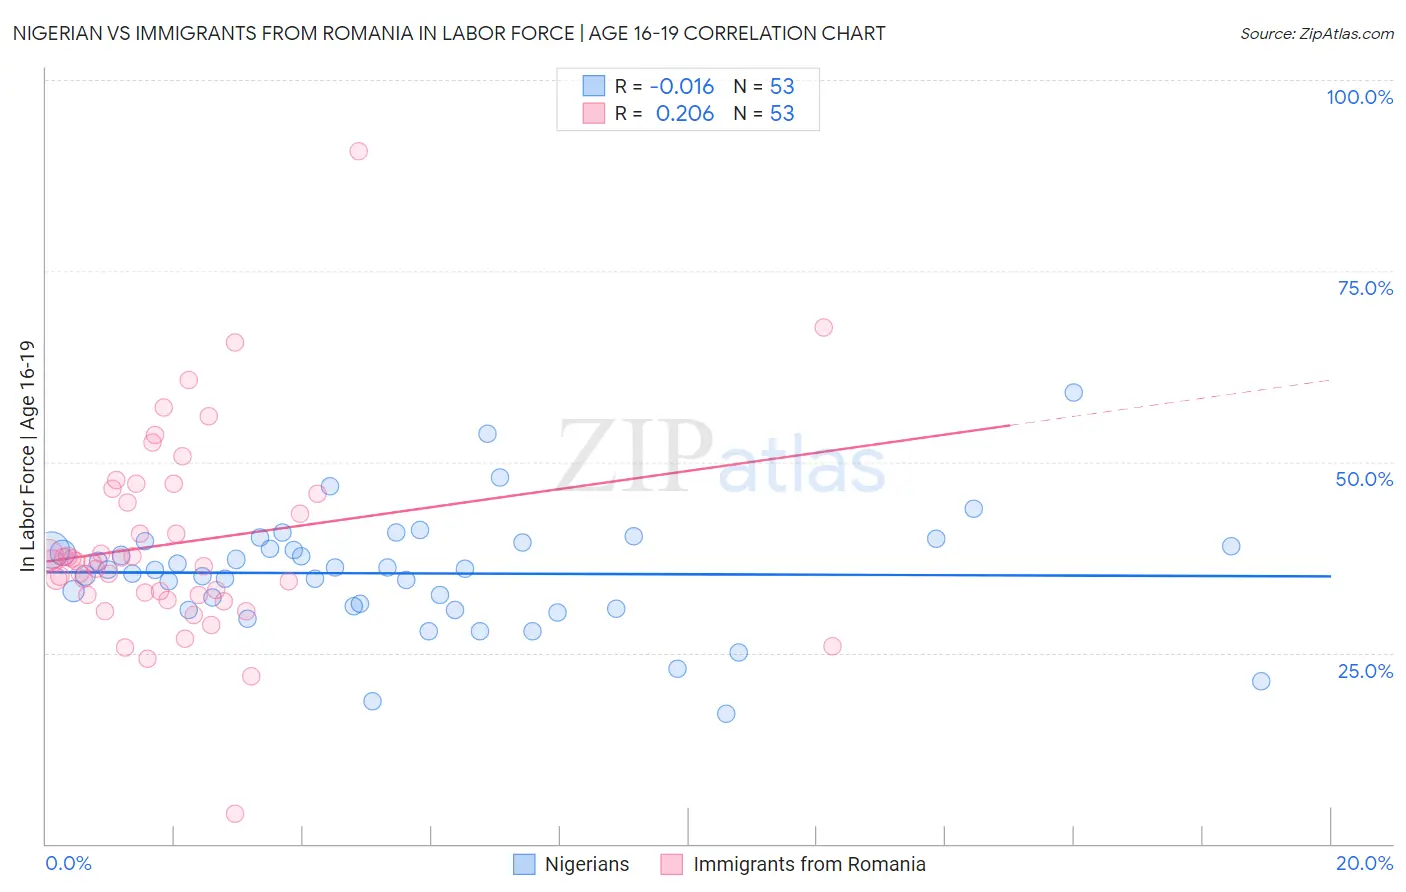
Nigerian vs Immigrants from Romania In Labor Force | Age 16-19 Correlation Chart
The statistical analysis conducted on geographies consisting of 332,555,349 people shows no correlation between the proportion of Nigerians and labor force participation rate among population between the ages 16 and 19 in the United States with a correlation coefficient (R) of -0.016 and weighted average of 36.1%. Similarly, the statistical analysis conducted on geographies consisting of 256,696,852 people shows a weak positive correlation between the proportion of Immigrants from Romania and labor force participation rate among population between the ages 16 and 19 in the United States with a correlation coefficient (R) of 0.206 and weighted average of 36.3%, a difference of 0.58%.
In Labor Force | Age 16-19 Correlation Summary
| Measurement | Nigerian | Immigrants from Romania |
| Minimum | 17.0% | 3.9% |
| Maximum | 59.1% | 90.6% |
| Range | 42.1% | 86.7% |
| Mean | 35.4% | 39.4% |
| Median | 35.9% | 37.0% |
| Interquartile 25% (IQ1) | 31.0% | 32.6% |
| Interquartile 75% (IQ3) | 39.2% | 46.1% |
| Interquartile Range (IQR) | 8.2% | 13.6% |
| Standard Deviation (Sample) | 7.5% | 13.3% |
| Standard Deviation (Population) | 7.5% | 13.2% |
Demographics Similar to Nigerians and Immigrants from Romania by In Labor Force | Age 16-19
In terms of in labor force | age 16-19, the demographic groups most similar to Nigerians are Immigrants from Denmark (36.1%, a difference of 0.030%), Afghan (36.1%, a difference of 0.070%), Bolivian (36.0%, a difference of 0.090%), Immigrants from Croatia (36.1%, a difference of 0.19%), and Panamanian (36.1%, a difference of 0.26%). Similarly, the demographic groups most similar to Immigrants from Romania are Immigrants from Afghanistan (36.3%, a difference of 0.0%), Bhutanese (36.3%, a difference of 0.070%), Costa Rican (36.3%, a difference of 0.12%), Immigrants from Europe (36.2%, a difference of 0.13%), and Eastern European (36.4%, a difference of 0.27%).
| Demographics | Rating | Rank | In Labor Force | Age 16-19 |
| Immigrants | Morocco | 41.1 /100 | #180 | Average 36.4% |
| Jordanians | 39.6 /100 | #181 | Fair 36.4% |
| Immigrants | Italy | 39.1 /100 | #182 | Fair 36.4% |
| Eastern Europeans | 38.8 /100 | #183 | Fair 36.4% |
| Costa Ricans | 36.1 /100 | #184 | Fair 36.3% |
| Bhutanese | 35.3 /100 | #185 | Fair 36.3% |
| Immigrants | Romania | 34.0 /100 | #186 | Fair 36.3% |
| Immigrants | Afghanistan | 34.0 /100 | #187 | Fair 36.3% |
| Immigrants | Europe | 31.8 /100 | #188 | Fair 36.2% |
| Immigrants | Hungary | 28.8 /100 | #189 | Fair 36.2% |
| Panamanians | 28.6 /100 | #190 | Fair 36.1% |
| Immigrants | Croatia | 27.5 /100 | #191 | Fair 36.1% |
| Afghans | 25.7 /100 | #192 | Fair 36.1% |
| Immigrants | Denmark | 25.0 /100 | #193 | Fair 36.1% |
| Nigerians | 24.6 /100 | #194 | Fair 36.1% |
| Bolivians | 23.3 /100 | #195 | Fair 36.0% |
| Mexican American Indians | 21.1 /100 | #196 | Fair 36.0% |
| Immigrants | Serbia | 21.0 /100 | #197 | Fair 36.0% |
| Immigrants | Northern Africa | 19.9 /100 | #198 | Poor 35.9% |
| Immigrants | Norway | 19.8 /100 | #199 | Poor 35.9% |
| Immigrants | Sweden | 18.8 /100 | #200 | Poor 35.9% |