Nigerian vs Romanian In Labor Force | Age 20-24
COMPARE
Nigerian
Romanian
In Labor Force | Age 20-24
In Labor Force | Age 20-24 Comparison
Nigerians
Romanians
74.7%
IN LABOR FORCE | AGE 20-24
21.9/ 100
METRIC RATING
200th/ 347
METRIC RANK
75.5%
IN LABOR FORCE | AGE 20-24
84.1/ 100
METRIC RATING
141st/ 347
METRIC RANK
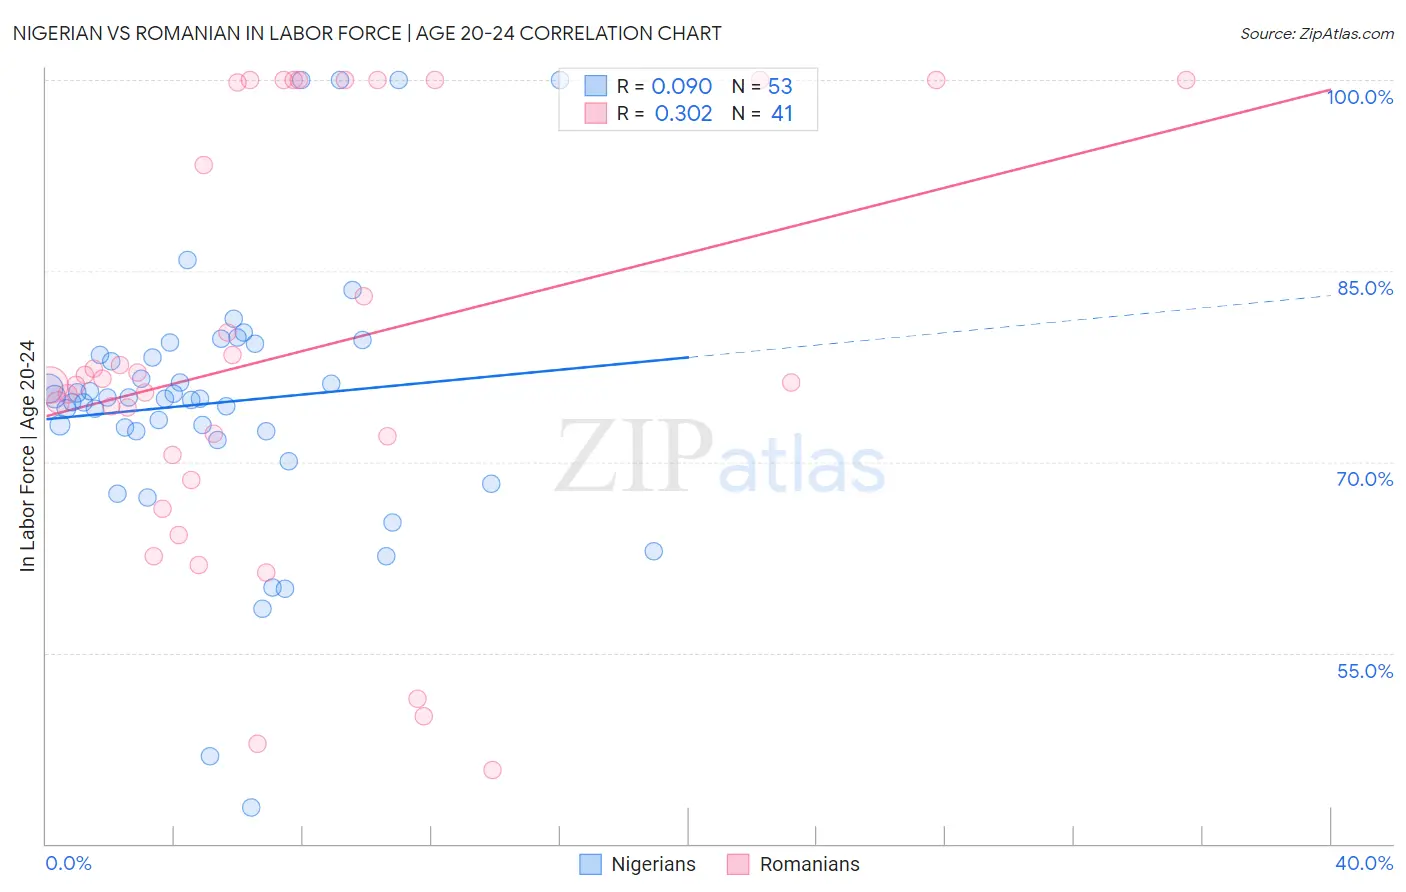
Nigerian vs Romanian In Labor Force | Age 20-24 Correlation Chart
The statistical analysis conducted on geographies consisting of 332,759,709 people shows a slight positive correlation between the proportion of Nigerians and labor force participation rate among population between the ages 20 and 24 in the United States with a correlation coefficient (R) of 0.090 and weighted average of 74.7%. Similarly, the statistical analysis conducted on geographies consisting of 377,715,651 people shows a mild positive correlation between the proportion of Romanians and labor force participation rate among population between the ages 20 and 24 in the United States with a correlation coefficient (R) of 0.302 and weighted average of 75.5%, a difference of 1.1%.
In Labor Force | Age 20-24 Correlation Summary
| Measurement | Nigerian | Romanian |
| Minimum | 42.8% | 45.8% |
| Maximum | 100.0% | 100.0% |
| Range | 57.2% | 54.2% |
| Mean | 74.7% | 78.5% |
| Median | 74.9% | 76.2% |
| Interquartile 25% (IQ1) | 72.1% | 69.6% |
| Interquartile 75% (IQ3) | 78.9% | 99.9% |
| Interquartile Range (IQR) | 6.8% | 30.3% |
| Standard Deviation (Sample) | 10.8% | 16.1% |
| Standard Deviation (Population) | 10.7% | 15.9% |
Similar Demographics by In Labor Force | Age 20-24
Demographics Similar to Nigerians by In Labor Force | Age 20-24
In terms of in labor force | age 20-24, the demographic groups most similar to Nigerians are Choctaw (74.7%, a difference of 0.010%), Taiwanese (74.7%, a difference of 0.030%), Moroccan (74.7%, a difference of 0.030%), Immigrants from Nigeria (74.7%, a difference of 0.050%), and Panamanian (74.7%, a difference of 0.060%).
| Demographics | Rating | Rank | In Labor Force | Age 20-24 |
| Alsatians | 27.1 /100 | #193 | Fair 74.8% |
| Immigrants | Denmark | 25.8 /100 | #194 | Fair 74.8% |
| Eastern Europeans | 25.4 /100 | #195 | Fair 74.8% |
| Immigrants | Vietnam | 25.1 /100 | #196 | Fair 74.7% |
| Panamanians | 25.0 /100 | #197 | Fair 74.7% |
| Immigrants | Nigeria | 24.2 /100 | #198 | Fair 74.7% |
| Taiwanese | 23.2 /100 | #199 | Fair 74.7% |
| Nigerians | 21.9 /100 | #200 | Fair 74.7% |
| Choctaw | 21.4 /100 | #201 | Fair 74.7% |
| Moroccans | 20.4 /100 | #202 | Fair 74.7% |
| Immigrants | Northern Africa | 17.9 /100 | #203 | Poor 74.6% |
| Immigrants | Italy | 17.6 /100 | #204 | Poor 74.6% |
| Inupiat | 17.6 /100 | #205 | Poor 74.6% |
| Sioux | 17.5 /100 | #206 | Poor 74.6% |
| Albanians | 16.2 /100 | #207 | Poor 74.6% |
Demographics Similar to Romanians by In Labor Force | Age 20-24
In terms of in labor force | age 20-24, the demographic groups most similar to Romanians are Immigrants from England (75.5%, a difference of 0.010%), Delaware (75.5%, a difference of 0.010%), Blackfeet (75.5%, a difference of 0.010%), Immigrants from Brazil (75.5%, a difference of 0.020%), and Jordanian (75.5%, a difference of 0.020%).
| Demographics | Rating | Rank | In Labor Force | Age 20-24 |
| Estonians | 87.1 /100 | #134 | Excellent 75.6% |
| Yaqui | 85.5 /100 | #135 | Excellent 75.5% |
| Immigrants | Brazil | 84.8 /100 | #136 | Excellent 75.5% |
| Jordanians | 84.8 /100 | #137 | Excellent 75.5% |
| Australians | 84.8 /100 | #138 | Excellent 75.5% |
| Immigrants | England | 84.6 /100 | #139 | Excellent 75.5% |
| Delaware | 84.5 /100 | #140 | Excellent 75.5% |
| Romanians | 84.1 /100 | #141 | Excellent 75.5% |
| Blackfeet | 83.6 /100 | #142 | Excellent 75.5% |
| Spaniards | 82.0 /100 | #143 | Excellent 75.5% |
| Bhutanese | 80.8 /100 | #144 | Excellent 75.4% |
| Koreans | 79.7 /100 | #145 | Good 75.4% |
| Mexican American Indians | 78.8 /100 | #146 | Good 75.4% |
| Comanche | 77.6 /100 | #147 | Good 75.4% |
| Immigrants | Cambodia | 76.7 /100 | #148 | Good 75.4% |