Brazilian vs Romanian In Labor Force | Age 20-24
COMPARE
Brazilian
Romanian
In Labor Force | Age 20-24
In Labor Force | Age 20-24 Comparison
Brazilians
Romanians
75.8%
IN LABOR FORCE | AGE 20-24
93.0/ 100
METRIC RATING
126th/ 347
METRIC RANK
75.5%
IN LABOR FORCE | AGE 20-24
84.1/ 100
METRIC RATING
141st/ 347
METRIC RANK
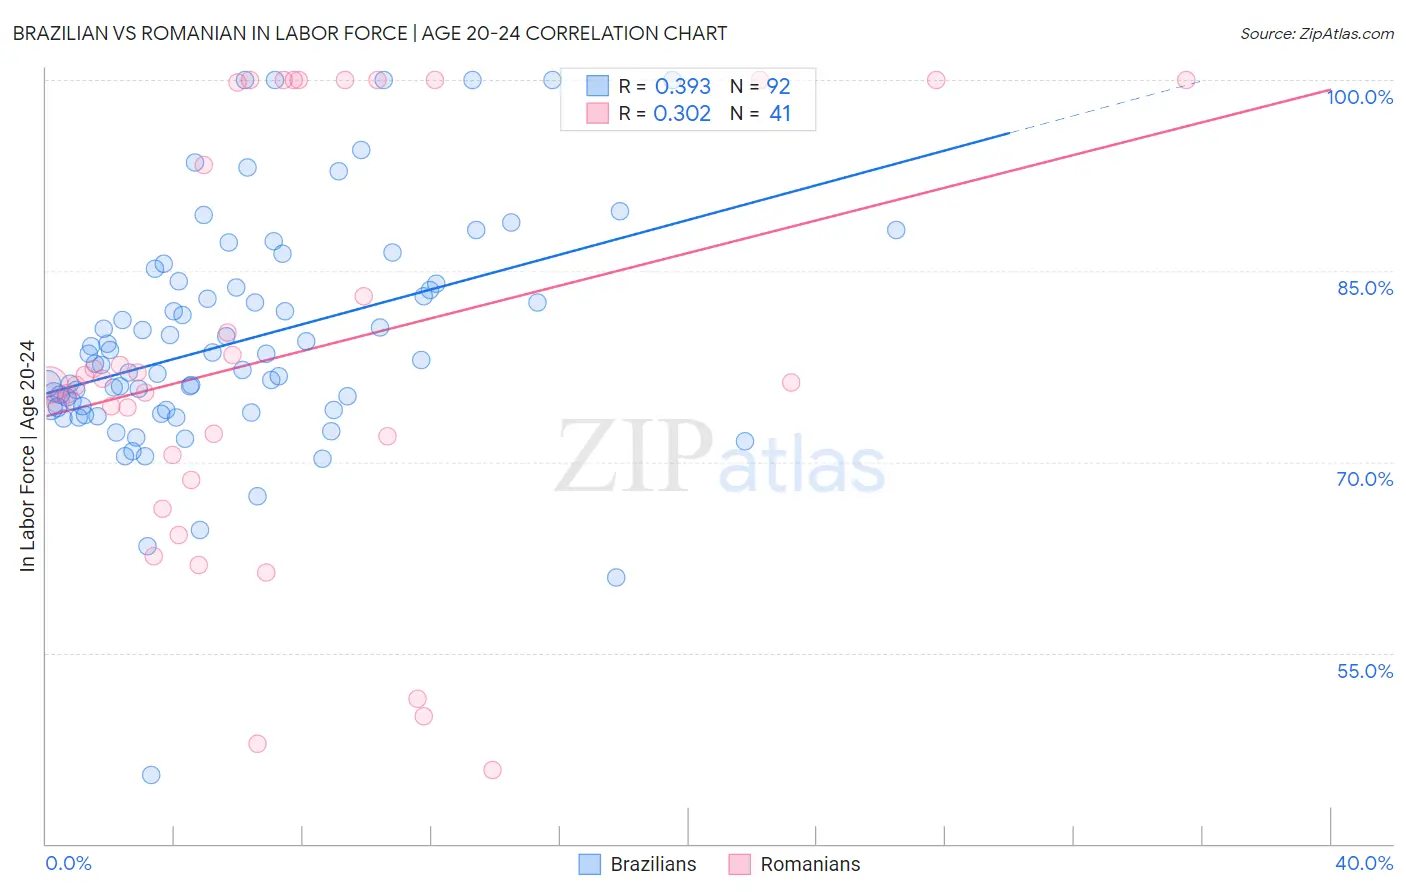
Brazilian vs Romanian In Labor Force | Age 20-24 Correlation Chart
The statistical analysis conducted on geographies consisting of 323,876,303 people shows a mild positive correlation between the proportion of Brazilians and labor force participation rate among population between the ages 20 and 24 in the United States with a correlation coefficient (R) of 0.393 and weighted average of 75.8%. Similarly, the statistical analysis conducted on geographies consisting of 377,715,651 people shows a mild positive correlation between the proportion of Romanians and labor force participation rate among population between the ages 20 and 24 in the United States with a correlation coefficient (R) of 0.302 and weighted average of 75.5%, a difference of 0.34%.
In Labor Force | Age 20-24 Correlation Summary
| Measurement | Brazilian | Romanian |
| Minimum | 45.4% | 45.8% |
| Maximum | 100.0% | 100.0% |
| Range | 54.6% | 54.2% |
| Mean | 79.5% | 78.5% |
| Median | 77.9% | 76.2% |
| Interquartile 25% (IQ1) | 74.2% | 69.6% |
| Interquartile 75% (IQ3) | 83.9% | 99.9% |
| Interquartile Range (IQR) | 9.7% | 30.3% |
| Standard Deviation (Sample) | 9.1% | 16.1% |
| Standard Deviation (Population) | 9.1% | 15.9% |
Demographics Similar to Brazilians and Romanians by In Labor Force | Age 20-24
In terms of in labor force | age 20-24, the demographic groups most similar to Brazilians are Immigrants from Scotland (75.8%, a difference of 0.040%), Immigrants from Sierra Leone (75.8%, a difference of 0.050%), Immigrants from Bulgaria (75.8%, a difference of 0.060%), Subsaharan African (75.7%, a difference of 0.11%), and Immigrants from Afghanistan (75.6%, a difference of 0.17%). Similarly, the demographic groups most similar to Romanians are Immigrants from England (75.5%, a difference of 0.010%), Delaware (75.5%, a difference of 0.010%), Blackfeet (75.5%, a difference of 0.010%), Immigrants from Brazil (75.5%, a difference of 0.020%), and Jordanian (75.5%, a difference of 0.020%).
| Demographics | Rating | Rank | In Labor Force | Age 20-24 |
| Immigrants | Bulgaria | 94.1 /100 | #123 | Exceptional 75.8% |
| Immigrants | Sierra Leone | 93.8 /100 | #124 | Exceptional 75.8% |
| Immigrants | Scotland | 93.7 /100 | #125 | Exceptional 75.8% |
| Brazilians | 93.0 /100 | #126 | Exceptional 75.8% |
| Sub-Saharan Africans | 90.9 /100 | #127 | Exceptional 75.7% |
| Immigrants | Afghanistan | 89.4 /100 | #128 | Excellent 75.6% |
| Iroquois | 89.1 /100 | #129 | Excellent 75.6% |
| Immigrants | Austria | 88.8 /100 | #130 | Excellent 75.6% |
| Immigrants | Jordan | 88.5 /100 | #131 | Excellent 75.6% |
| Palestinians | 88.4 /100 | #132 | Excellent 75.6% |
| Zimbabweans | 88.2 /100 | #133 | Excellent 75.6% |
| Estonians | 87.1 /100 | #134 | Excellent 75.6% |
| Yaqui | 85.5 /100 | #135 | Excellent 75.5% |
| Immigrants | Brazil | 84.8 /100 | #136 | Excellent 75.5% |
| Jordanians | 84.8 /100 | #137 | Excellent 75.5% |
| Australians | 84.8 /100 | #138 | Excellent 75.5% |
| Immigrants | England | 84.6 /100 | #139 | Excellent 75.5% |
| Delaware | 84.5 /100 | #140 | Excellent 75.5% |
| Romanians | 84.1 /100 | #141 | Excellent 75.5% |
| Blackfeet | 83.6 /100 | #142 | Excellent 75.5% |
| Spaniards | 82.0 /100 | #143 | Excellent 75.5% |