Nigerian vs Black/African American In Labor Force | Age 20-24
COMPARE
Nigerian
Black/African American
In Labor Force | Age 20-24
In Labor Force | Age 20-24 Comparison
Nigerians
Blacks/African Americans
74.7%
IN LABOR FORCE | AGE 20-24
21.9/ 100
METRIC RATING
200th/ 347
METRIC RANK
73.9%
IN LABOR FORCE | AGE 20-24
1.3/ 100
METRIC RATING
249th/ 347
METRIC RANK
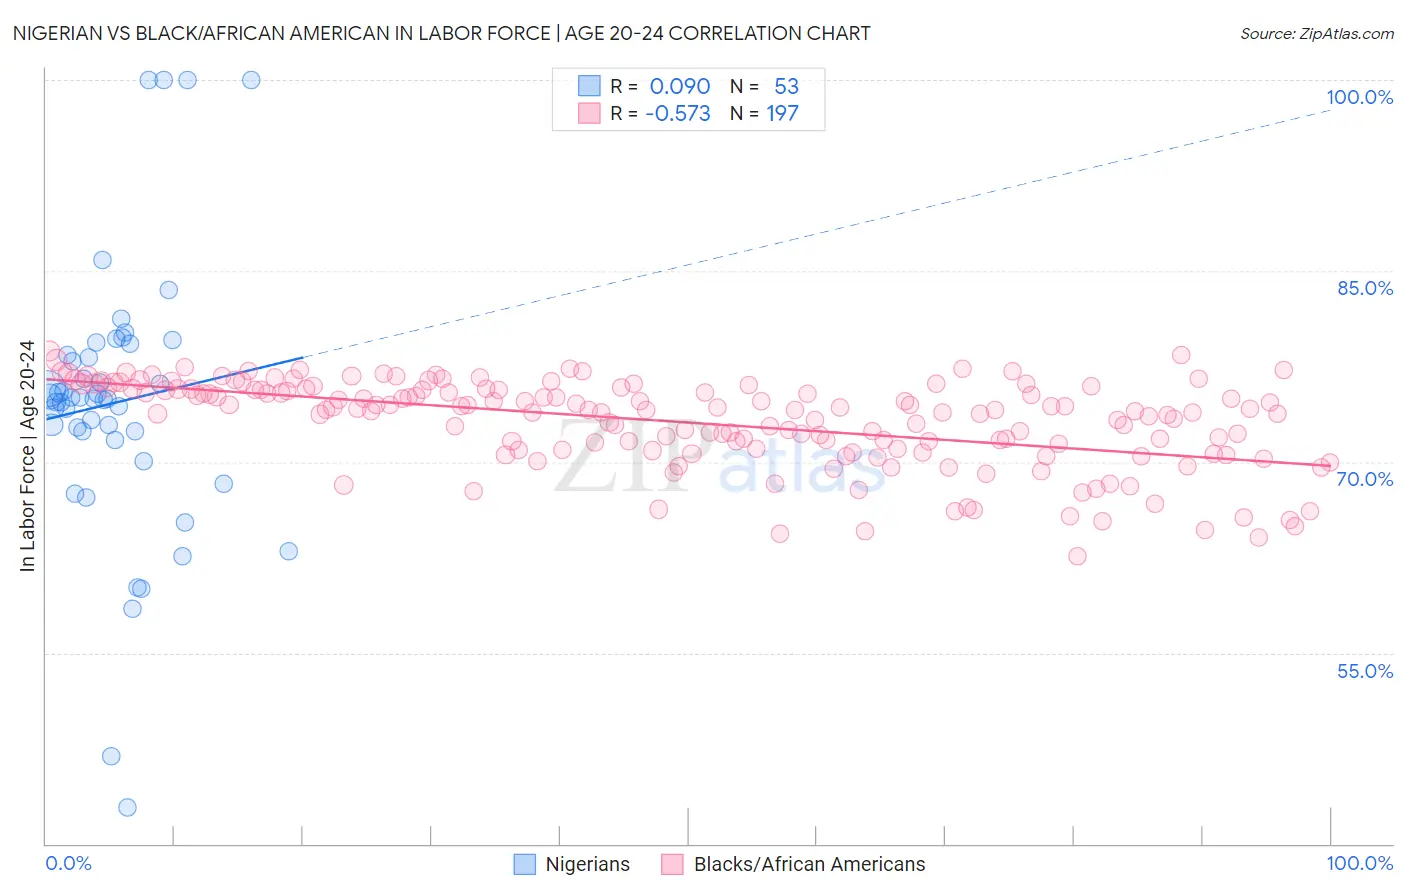
Nigerian vs Black/African American In Labor Force | Age 20-24 Correlation Chart
The statistical analysis conducted on geographies consisting of 332,759,709 people shows a slight positive correlation between the proportion of Nigerians and labor force participation rate among population between the ages 20 and 24 in the United States with a correlation coefficient (R) of 0.090 and weighted average of 74.7%. Similarly, the statistical analysis conducted on geographies consisting of 564,749,876 people shows a substantial negative correlation between the proportion of Blacks/African Americans and labor force participation rate among population between the ages 20 and 24 in the United States with a correlation coefficient (R) of -0.573 and weighted average of 73.9%, a difference of 1.1%.
In Labor Force | Age 20-24 Correlation Summary
| Measurement | Nigerian | Black/African American |
| Minimum | 42.8% | 62.6% |
| Maximum | 100.0% | 78.7% |
| Range | 57.2% | 16.1% |
| Mean | 74.7% | 73.1% |
| Median | 74.9% | 74.1% |
| Interquartile 25% (IQ1) | 72.1% | 71.0% |
| Interquartile 75% (IQ3) | 78.9% | 75.7% |
| Interquartile Range (IQR) | 6.8% | 4.7% |
| Standard Deviation (Sample) | 10.8% | 3.4% |
| Standard Deviation (Population) | 10.7% | 3.4% |
Similar Demographics by In Labor Force | Age 20-24
Demographics Similar to Nigerians by In Labor Force | Age 20-24
In terms of in labor force | age 20-24, the demographic groups most similar to Nigerians are Choctaw (74.7%, a difference of 0.010%), Taiwanese (74.7%, a difference of 0.030%), Moroccan (74.7%, a difference of 0.030%), Immigrants from Nigeria (74.7%, a difference of 0.050%), and Panamanian (74.7%, a difference of 0.060%).
| Demographics | Rating | Rank | In Labor Force | Age 20-24 |
| Alsatians | 27.1 /100 | #193 | Fair 74.8% |
| Immigrants | Denmark | 25.8 /100 | #194 | Fair 74.8% |
| Eastern Europeans | 25.4 /100 | #195 | Fair 74.8% |
| Immigrants | Vietnam | 25.1 /100 | #196 | Fair 74.7% |
| Panamanians | 25.0 /100 | #197 | Fair 74.7% |
| Immigrants | Nigeria | 24.2 /100 | #198 | Fair 74.7% |
| Taiwanese | 23.2 /100 | #199 | Fair 74.7% |
| Nigerians | 21.9 /100 | #200 | Fair 74.7% |
| Choctaw | 21.4 /100 | #201 | Fair 74.7% |
| Moroccans | 20.4 /100 | #202 | Fair 74.7% |
| Immigrants | Northern Africa | 17.9 /100 | #203 | Poor 74.6% |
| Immigrants | Italy | 17.6 /100 | #204 | Poor 74.6% |
| Inupiat | 17.6 /100 | #205 | Poor 74.6% |
| Sioux | 17.5 /100 | #206 | Poor 74.6% |
| Albanians | 16.2 /100 | #207 | Poor 74.6% |
Demographics Similar to Blacks/African Americans by In Labor Force | Age 20-24
In terms of in labor force | age 20-24, the demographic groups most similar to Blacks/African Americans are Immigrants from Belgium (73.9%, a difference of 0.0%), Immigrants from Egypt (73.8%, a difference of 0.020%), Immigrants from Kazakhstan (73.8%, a difference of 0.040%), Colville (73.9%, a difference of 0.050%), and Immigrants from Saudi Arabia (73.9%, a difference of 0.050%).
| Demographics | Rating | Rank | In Labor Force | Age 20-24 |
| Thais | 2.1 /100 | #242 | Tragic 74.0% |
| Immigrants | Syria | 1.9 /100 | #243 | Tragic 74.0% |
| Immigrants | South Central Asia | 1.9 /100 | #244 | Tragic 74.0% |
| Turks | 1.8 /100 | #245 | Tragic 73.9% |
| Immigrants | Panama | 1.6 /100 | #246 | Tragic 73.9% |
| Colville | 1.5 /100 | #247 | Tragic 73.9% |
| Immigrants | Saudi Arabia | 1.5 /100 | #248 | Tragic 73.9% |
| Blacks/African Americans | 1.3 /100 | #249 | Tragic 73.9% |
| Immigrants | Belgium | 1.3 /100 | #250 | Tragic 73.9% |
| Immigrants | Egypt | 1.2 /100 | #251 | Tragic 73.8% |
| Immigrants | Kazakhstan | 1.1 /100 | #252 | Tragic 73.8% |
| Arapaho | 1.0 /100 | #253 | Tragic 73.8% |
| Ute | 1.0 /100 | #254 | Tragic 73.8% |
| Immigrants | Pakistan | 0.9 /100 | #255 | Tragic 73.8% |
| Spanish American Indians | 0.8 /100 | #256 | Tragic 73.7% |