Nigerian vs Asian In Labor Force | Age 20-24
COMPARE
Nigerian
Asian
In Labor Force | Age 20-24
In Labor Force | Age 20-24 Comparison
Nigerians
Asians
74.7%
IN LABOR FORCE | AGE 20-24
21.9/ 100
METRIC RATING
200th/ 347
METRIC RANK
73.7%
IN LABOR FORCE | AGE 20-24
0.6/ 100
METRIC RATING
262nd/ 347
METRIC RANK
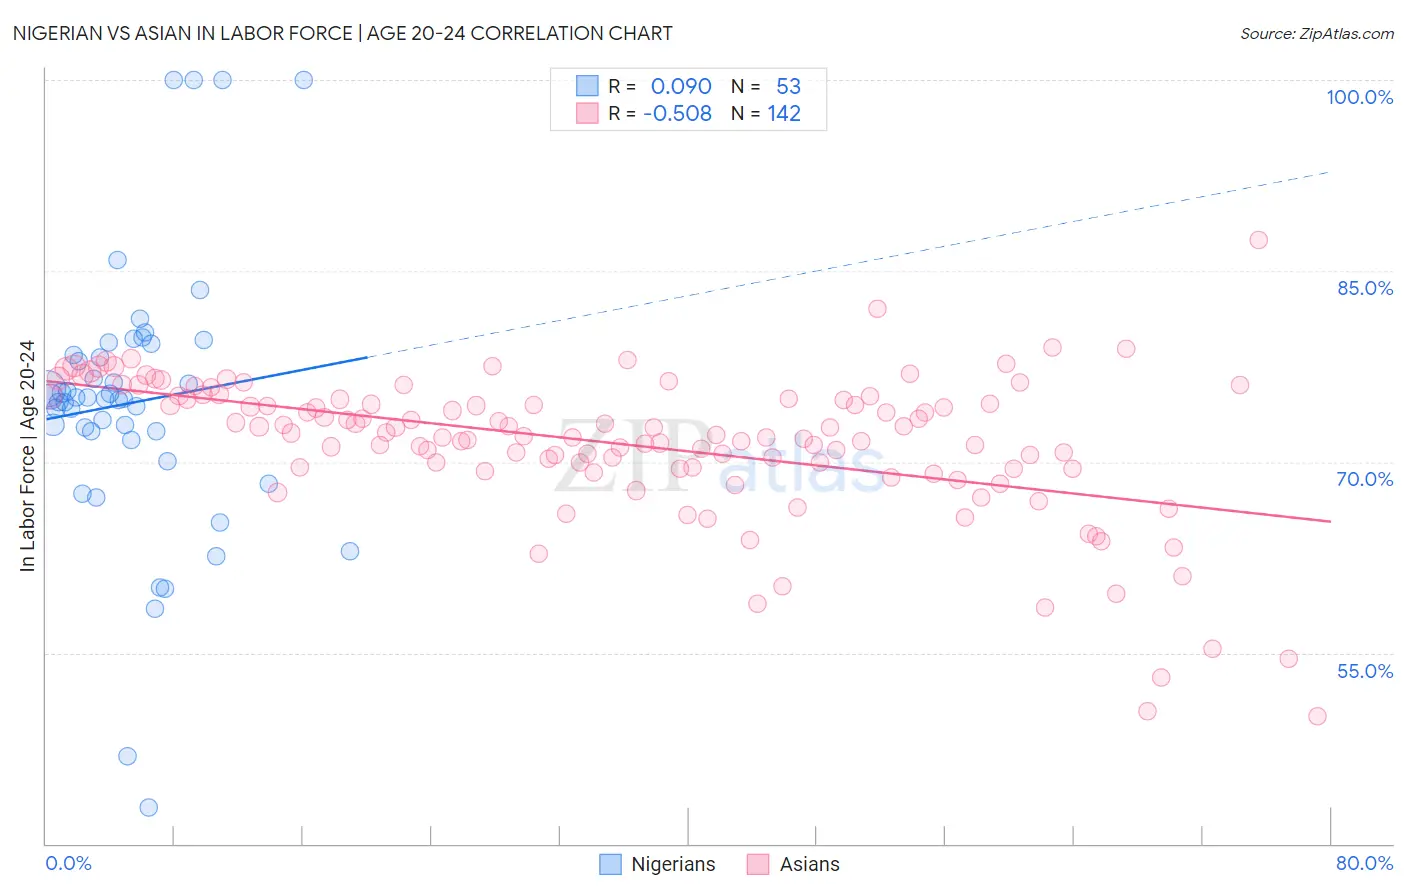
Nigerian vs Asian In Labor Force | Age 20-24 Correlation Chart
The statistical analysis conducted on geographies consisting of 332,759,709 people shows a slight positive correlation between the proportion of Nigerians and labor force participation rate among population between the ages 20 and 24 in the United States with a correlation coefficient (R) of 0.090 and weighted average of 74.7%. Similarly, the statistical analysis conducted on geographies consisting of 550,133,800 people shows a substantial negative correlation between the proportion of Asians and labor force participation rate among population between the ages 20 and 24 in the United States with a correlation coefficient (R) of -0.508 and weighted average of 73.7%, a difference of 1.4%.
In Labor Force | Age 20-24 Correlation Summary
| Measurement | Nigerian | Asian |
| Minimum | 42.8% | 50.0% |
| Maximum | 100.0% | 87.4% |
| Range | 57.2% | 37.4% |
| Mean | 74.7% | 71.4% |
| Median | 74.9% | 72.2% |
| Interquartile 25% (IQ1) | 72.1% | 69.5% |
| Interquartile 75% (IQ3) | 78.9% | 75.0% |
| Interquartile Range (IQR) | 6.8% | 5.5% |
| Standard Deviation (Sample) | 10.8% | 5.8% |
| Standard Deviation (Population) | 10.7% | 5.8% |
Similar Demographics by In Labor Force | Age 20-24
Demographics Similar to Nigerians by In Labor Force | Age 20-24
In terms of in labor force | age 20-24, the demographic groups most similar to Nigerians are Choctaw (74.7%, a difference of 0.010%), Taiwanese (74.7%, a difference of 0.030%), Moroccan (74.7%, a difference of 0.030%), Immigrants from Nigeria (74.7%, a difference of 0.050%), and Panamanian (74.7%, a difference of 0.060%).
| Demographics | Rating | Rank | In Labor Force | Age 20-24 |
| Alsatians | 27.1 /100 | #193 | Fair 74.8% |
| Immigrants | Denmark | 25.8 /100 | #194 | Fair 74.8% |
| Eastern Europeans | 25.4 /100 | #195 | Fair 74.8% |
| Immigrants | Vietnam | 25.1 /100 | #196 | Fair 74.7% |
| Panamanians | 25.0 /100 | #197 | Fair 74.7% |
| Immigrants | Nigeria | 24.2 /100 | #198 | Fair 74.7% |
| Taiwanese | 23.2 /100 | #199 | Fair 74.7% |
| Nigerians | 21.9 /100 | #200 | Fair 74.7% |
| Choctaw | 21.4 /100 | #201 | Fair 74.7% |
| Moroccans | 20.4 /100 | #202 | Fair 74.7% |
| Immigrants | Northern Africa | 17.9 /100 | #203 | Poor 74.6% |
| Immigrants | Italy | 17.6 /100 | #204 | Poor 74.6% |
| Inupiat | 17.6 /100 | #205 | Poor 74.6% |
| Sioux | 17.5 /100 | #206 | Poor 74.6% |
| Albanians | 16.2 /100 | #207 | Poor 74.6% |
Demographics Similar to Asians by In Labor Force | Age 20-24
In terms of in labor force | age 20-24, the demographic groups most similar to Asians are Houma (73.7%, a difference of 0.010%), Immigrants from Turkey (73.7%, a difference of 0.020%), Egyptian (73.7%, a difference of 0.050%), Dutch West Indian (73.7%, a difference of 0.050%), and Immigrants from Asia (73.6%, a difference of 0.080%).
| Demographics | Rating | Rank | In Labor Force | Age 20-24 |
| Immigrants | Pakistan | 0.9 /100 | #255 | Tragic 73.8% |
| Spanish American Indians | 0.8 /100 | #256 | Tragic 73.7% |
| Paraguayans | 0.8 /100 | #257 | Tragic 73.7% |
| Egyptians | 0.7 /100 | #258 | Tragic 73.7% |
| Dutch West Indians | 0.7 /100 | #259 | Tragic 73.7% |
| Immigrants | Turkey | 0.7 /100 | #260 | Tragic 73.7% |
| Houma | 0.6 /100 | #261 | Tragic 73.7% |
| Asians | 0.6 /100 | #262 | Tragic 73.7% |
| Immigrants | Asia | 0.5 /100 | #263 | Tragic 73.6% |
| Immigrants | Haiti | 0.5 /100 | #264 | Tragic 73.6% |
| Burmese | 0.5 /100 | #265 | Tragic 73.6% |
| Haitians | 0.5 /100 | #266 | Tragic 73.6% |
| Immigrants | Western Asia | 0.4 /100 | #267 | Tragic 73.5% |
| South Americans | 0.4 /100 | #268 | Tragic 73.5% |
| Colombians | 0.3 /100 | #269 | Tragic 73.5% |