Nigerian vs Immigrants from Eastern Asia In Labor Force | Age 20-24
COMPARE
Nigerian
Immigrants from Eastern Asia
In Labor Force | Age 20-24
In Labor Force | Age 20-24 Comparison
Nigerians
Immigrants from Eastern Asia
74.7%
IN LABOR FORCE | AGE 20-24
21.9/ 100
METRIC RATING
200th/ 347
METRIC RANK
71.8%
IN LABOR FORCE | AGE 20-24
0.0/ 100
METRIC RATING
316th/ 347
METRIC RANK
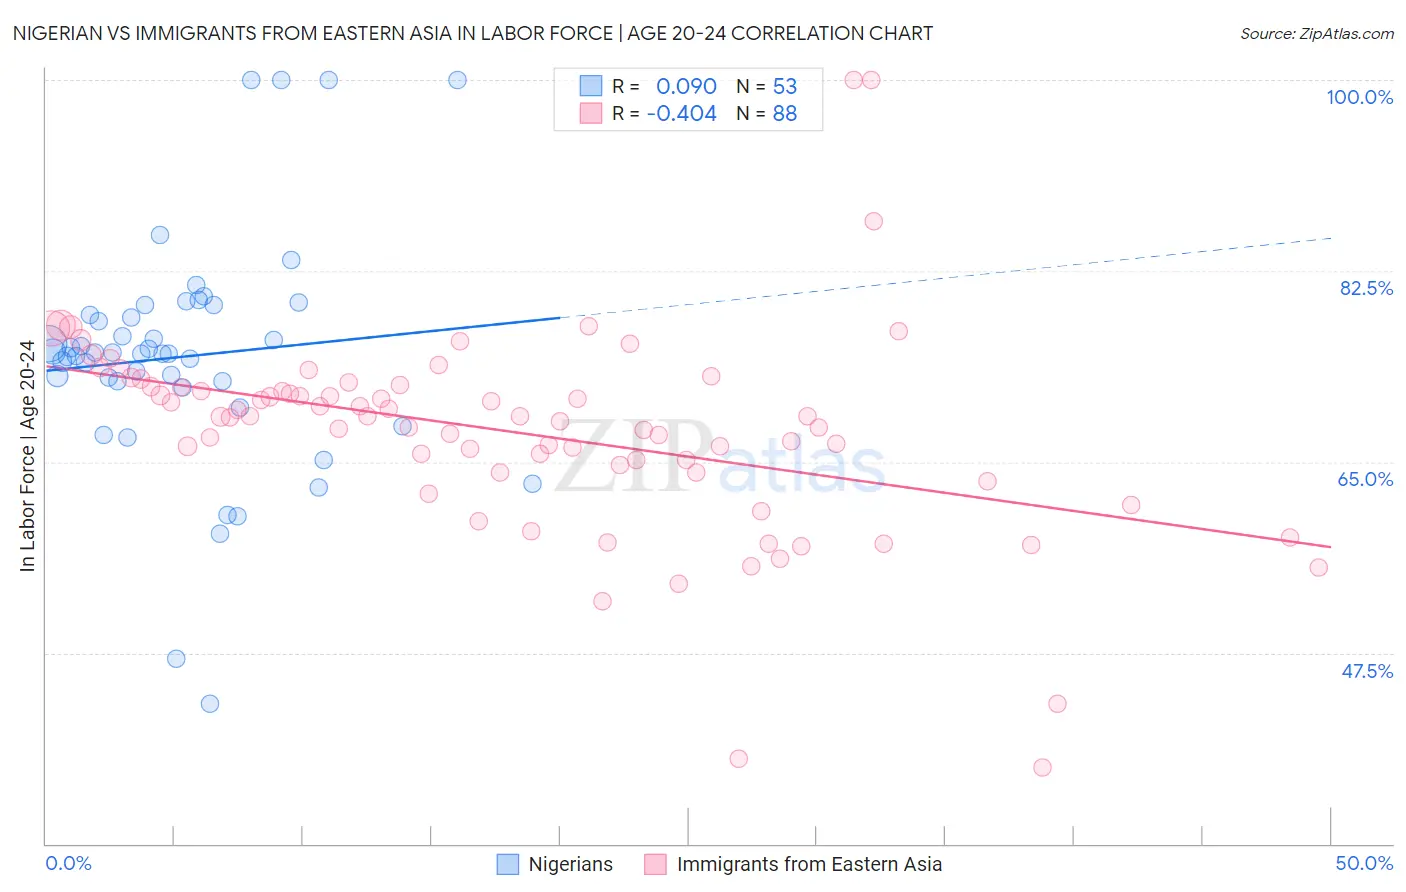
Nigerian vs Immigrants from Eastern Asia In Labor Force | Age 20-24 Correlation Chart
The statistical analysis conducted on geographies consisting of 332,759,709 people shows a slight positive correlation between the proportion of Nigerians and labor force participation rate among population between the ages 20 and 24 in the United States with a correlation coefficient (R) of 0.090 and weighted average of 74.7%. Similarly, the statistical analysis conducted on geographies consisting of 499,591,558 people shows a moderate negative correlation between the proportion of Immigrants from Eastern Asia and labor force participation rate among population between the ages 20 and 24 in the United States with a correlation coefficient (R) of -0.404 and weighted average of 71.8%, a difference of 4.1%.
In Labor Force | Age 20-24 Correlation Summary
| Measurement | Nigerian | Immigrants from Eastern Asia |
| Minimum | 42.8% | 37.0% |
| Maximum | 100.0% | 100.0% |
| Range | 57.2% | 63.0% |
| Mean | 74.7% | 67.7% |
| Median | 74.9% | 69.1% |
| Interquartile 25% (IQ1) | 72.1% | 64.3% |
| Interquartile 75% (IQ3) | 78.9% | 72.0% |
| Interquartile Range (IQR) | 6.8% | 7.6% |
| Standard Deviation (Sample) | 10.8% | 9.6% |
| Standard Deviation (Population) | 10.7% | 9.5% |
Similar Demographics by In Labor Force | Age 20-24
Demographics Similar to Nigerians by In Labor Force | Age 20-24
In terms of in labor force | age 20-24, the demographic groups most similar to Nigerians are Choctaw (74.7%, a difference of 0.010%), Taiwanese (74.7%, a difference of 0.030%), Moroccan (74.7%, a difference of 0.030%), Immigrants from Nigeria (74.7%, a difference of 0.050%), and Panamanian (74.7%, a difference of 0.060%).
| Demographics | Rating | Rank | In Labor Force | Age 20-24 |
| Alsatians | 27.1 /100 | #193 | Fair 74.8% |
| Immigrants | Denmark | 25.8 /100 | #194 | Fair 74.8% |
| Eastern Europeans | 25.4 /100 | #195 | Fair 74.8% |
| Immigrants | Vietnam | 25.1 /100 | #196 | Fair 74.7% |
| Panamanians | 25.0 /100 | #197 | Fair 74.7% |
| Immigrants | Nigeria | 24.2 /100 | #198 | Fair 74.7% |
| Taiwanese | 23.2 /100 | #199 | Fair 74.7% |
| Nigerians | 21.9 /100 | #200 | Fair 74.7% |
| Choctaw | 21.4 /100 | #201 | Fair 74.7% |
| Moroccans | 20.4 /100 | #202 | Fair 74.7% |
| Immigrants | Northern Africa | 17.9 /100 | #203 | Poor 74.6% |
| Immigrants | Italy | 17.6 /100 | #204 | Poor 74.6% |
| Inupiat | 17.6 /100 | #205 | Poor 74.6% |
| Sioux | 17.5 /100 | #206 | Poor 74.6% |
| Albanians | 16.2 /100 | #207 | Poor 74.6% |
Demographics Similar to Immigrants from Eastern Asia by In Labor Force | Age 20-24
In terms of in labor force | age 20-24, the demographic groups most similar to Immigrants from Eastern Asia are Immigrants from Iran (71.8%, a difference of 0.040%), Indian (Asian) (71.9%, a difference of 0.13%), Immigrants from Dominica (71.9%, a difference of 0.14%), Immigrants from Armenia (71.7%, a difference of 0.17%), and Immigrants from Caribbean (71.9%, a difference of 0.19%).
| Demographics | Rating | Rank | In Labor Force | Age 20-24 |
| Tsimshian | 0.0 /100 | #309 | Tragic 72.3% |
| Immigrants | Cuba | 0.0 /100 | #310 | Tragic 72.0% |
| Apache | 0.0 /100 | #311 | Tragic 72.0% |
| Immigrants | Caribbean | 0.0 /100 | #312 | Tragic 71.9% |
| Immigrants | Dominica | 0.0 /100 | #313 | Tragic 71.9% |
| Indians (Asian) | 0.0 /100 | #314 | Tragic 71.9% |
| Immigrants | Iran | 0.0 /100 | #315 | Tragic 71.8% |
| Immigrants | Eastern Asia | 0.0 /100 | #316 | Tragic 71.8% |
| Immigrants | Armenia | 0.0 /100 | #317 | Tragic 71.7% |
| Immigrants | Hong Kong | 0.0 /100 | #318 | Tragic 71.6% |
| Immigrants | Israel | 0.0 /100 | #319 | Tragic 71.6% |
| Trinidadians and Tobagonians | 0.0 /100 | #320 | Tragic 71.5% |
| Immigrants | Taiwan | 0.0 /100 | #321 | Tragic 71.5% |
| Filipinos | 0.0 /100 | #322 | Tragic 71.4% |
| West Indians | 0.0 /100 | #323 | Tragic 71.3% |