Immigrants from North Macedonia vs Immigrants from Eastern Asia In Labor Force | Age 20-24
COMPARE
Immigrants from North Macedonia
Immigrants from Eastern Asia
In Labor Force | Age 20-24
In Labor Force | Age 20-24 Comparison
Immigrants from North Macedonia
Immigrants from Eastern Asia
76.1%
IN LABOR FORCE | AGE 20-24
97.5/ 100
METRIC RATING
103rd/ 347
METRIC RANK
71.8%
IN LABOR FORCE | AGE 20-24
0.0/ 100
METRIC RATING
316th/ 347
METRIC RANK
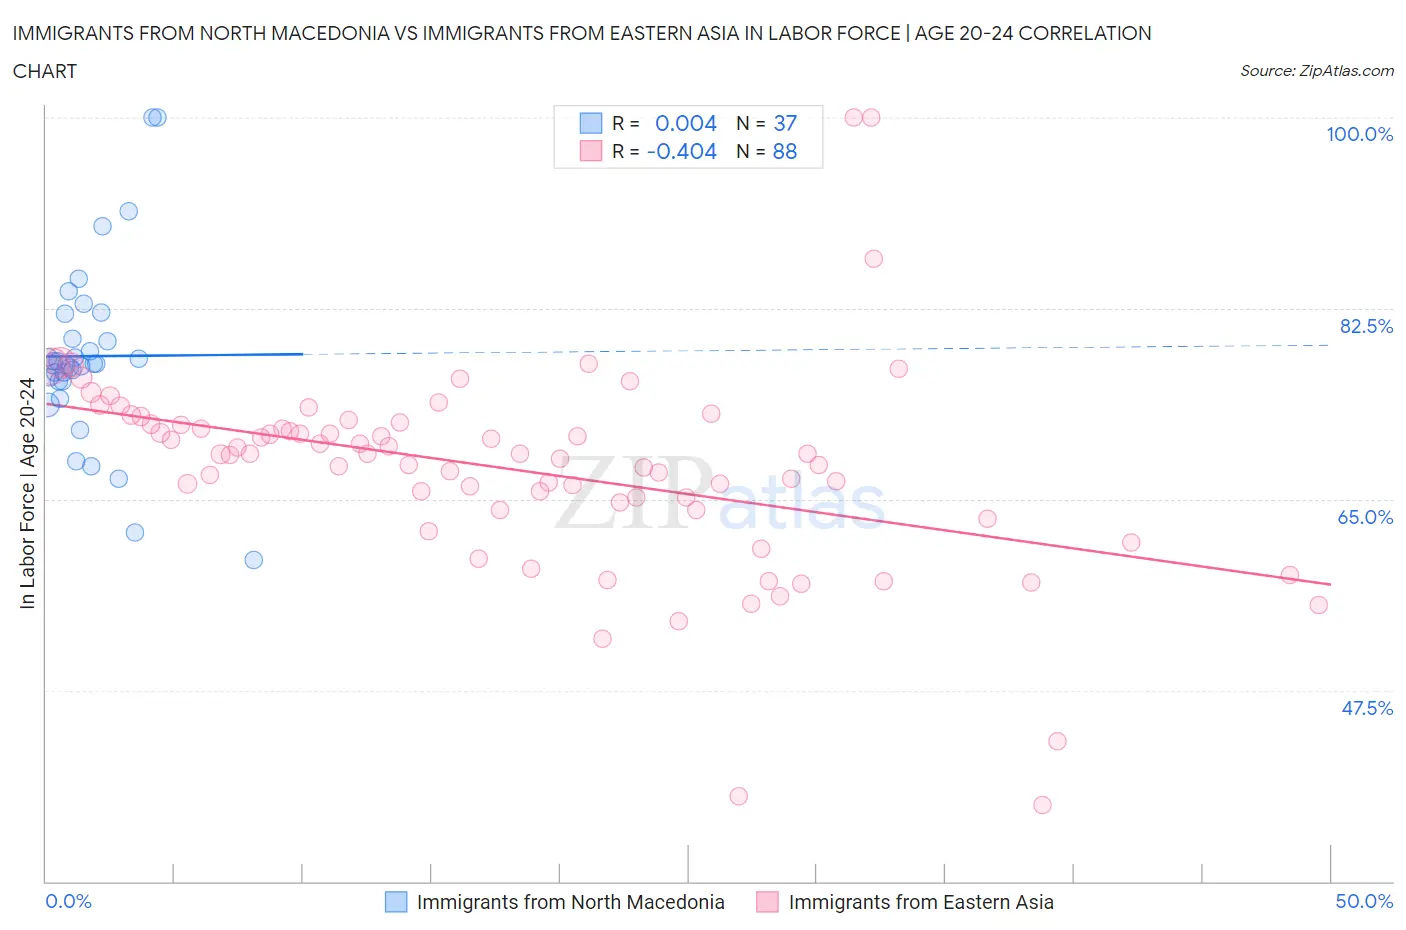
Immigrants from North Macedonia vs Immigrants from Eastern Asia In Labor Force | Age 20-24 Correlation Chart
The statistical analysis conducted on geographies consisting of 74,315,577 people shows no correlation between the proportion of Immigrants from North Macedonia and labor force participation rate among population between the ages 20 and 24 in the United States with a correlation coefficient (R) of 0.004 and weighted average of 76.1%. Similarly, the statistical analysis conducted on geographies consisting of 499,591,558 people shows a moderate negative correlation between the proportion of Immigrants from Eastern Asia and labor force participation rate among population between the ages 20 and 24 in the United States with a correlation coefficient (R) of -0.404 and weighted average of 71.8%, a difference of 5.9%.
In Labor Force | Age 20-24 Correlation Summary
| Measurement | Immigrants from North Macedonia | Immigrants from Eastern Asia |
| Minimum | 59.5% | 37.0% |
| Maximum | 100.0% | 100.0% |
| Range | 40.5% | 63.0% |
| Mean | 78.1% | 67.7% |
| Median | 77.4% | 69.1% |
| Interquartile 25% (IQ1) | 75.8% | 64.3% |
| Interquartile 75% (IQ3) | 80.8% | 72.0% |
| Interquartile Range (IQR) | 5.0% | 7.6% |
| Standard Deviation (Sample) | 8.3% | 9.6% |
| Standard Deviation (Population) | 8.1% | 9.5% |
Similar Demographics by In Labor Force | Age 20-24
Demographics Similar to Immigrants from North Macedonia by In Labor Force | Age 20-24
In terms of in labor force | age 20-24, the demographic groups most similar to Immigrants from North Macedonia are Latvian (76.1%, a difference of 0.020%), Immigrants from Poland (76.1%, a difference of 0.030%), Shoshone (76.1%, a difference of 0.040%), Macedonian (76.0%, a difference of 0.040%), and Immigrants from Nepal (76.0%, a difference of 0.040%).
| Demographics | Rating | Rank | In Labor Force | Age 20-24 |
| Immigrants | Nonimmigrants | 98.5 /100 | #96 | Exceptional 76.2% |
| Immigrants | Lithuania | 98.0 /100 | #97 | Exceptional 76.1% |
| Immigrants | Oceania | 98.0 /100 | #98 | Exceptional 76.1% |
| Americans | 97.8 /100 | #99 | Exceptional 76.1% |
| Shoshone | 97.8 /100 | #100 | Exceptional 76.1% |
| Immigrants | Poland | 97.7 /100 | #101 | Exceptional 76.1% |
| Latvians | 97.6 /100 | #102 | Exceptional 76.1% |
| Immigrants | North Macedonia | 97.5 /100 | #103 | Exceptional 76.1% |
| Macedonians | 97.2 /100 | #104 | Exceptional 76.0% |
| Immigrants | Nepal | 97.2 /100 | #105 | Exceptional 76.0% |
| Immigrants | Uganda | 97.1 /100 | #106 | Exceptional 76.0% |
| Greeks | 96.9 /100 | #107 | Exceptional 76.0% |
| Iraqis | 96.6 /100 | #108 | Exceptional 76.0% |
| Cherokee | 95.8 /100 | #109 | Exceptional 75.9% |
| Immigrants | Morocco | 95.8 /100 | #110 | Exceptional 75.9% |
Demographics Similar to Immigrants from Eastern Asia by In Labor Force | Age 20-24
In terms of in labor force | age 20-24, the demographic groups most similar to Immigrants from Eastern Asia are Immigrants from Iran (71.8%, a difference of 0.040%), Indian (Asian) (71.9%, a difference of 0.13%), Immigrants from Dominica (71.9%, a difference of 0.14%), Immigrants from Armenia (71.7%, a difference of 0.17%), and Immigrants from Caribbean (71.9%, a difference of 0.19%).
| Demographics | Rating | Rank | In Labor Force | Age 20-24 |
| Tsimshian | 0.0 /100 | #309 | Tragic 72.3% |
| Immigrants | Cuba | 0.0 /100 | #310 | Tragic 72.0% |
| Apache | 0.0 /100 | #311 | Tragic 72.0% |
| Immigrants | Caribbean | 0.0 /100 | #312 | Tragic 71.9% |
| Immigrants | Dominica | 0.0 /100 | #313 | Tragic 71.9% |
| Indians (Asian) | 0.0 /100 | #314 | Tragic 71.9% |
| Immigrants | Iran | 0.0 /100 | #315 | Tragic 71.8% |
| Immigrants | Eastern Asia | 0.0 /100 | #316 | Tragic 71.8% |
| Immigrants | Armenia | 0.0 /100 | #317 | Tragic 71.7% |
| Immigrants | Hong Kong | 0.0 /100 | #318 | Tragic 71.6% |
| Immigrants | Israel | 0.0 /100 | #319 | Tragic 71.6% |
| Trinidadians and Tobagonians | 0.0 /100 | #320 | Tragic 71.5% |
| Immigrants | Taiwan | 0.0 /100 | #321 | Tragic 71.5% |
| Filipinos | 0.0 /100 | #322 | Tragic 71.4% |
| West Indians | 0.0 /100 | #323 | Tragic 71.3% |