Nigerian vs Black/African American Unemployment Among Seniors over 75 years
COMPARE
Nigerian
Black/African American
Unemployment Among Seniors over 75 years
Unemployment Among Seniors over 75 years Comparison
Nigerians
Blacks/African Americans
9.7%
UNEMPLOYMENT AMONG SENIORS OVER 75 YEARS
0.0/ 100
METRIC RATING
286th/ 347
METRIC RANK
9.4%
UNEMPLOYMENT AMONG SENIORS OVER 75 YEARS
0.5/ 100
METRIC RATING
266th/ 347
METRIC RANK
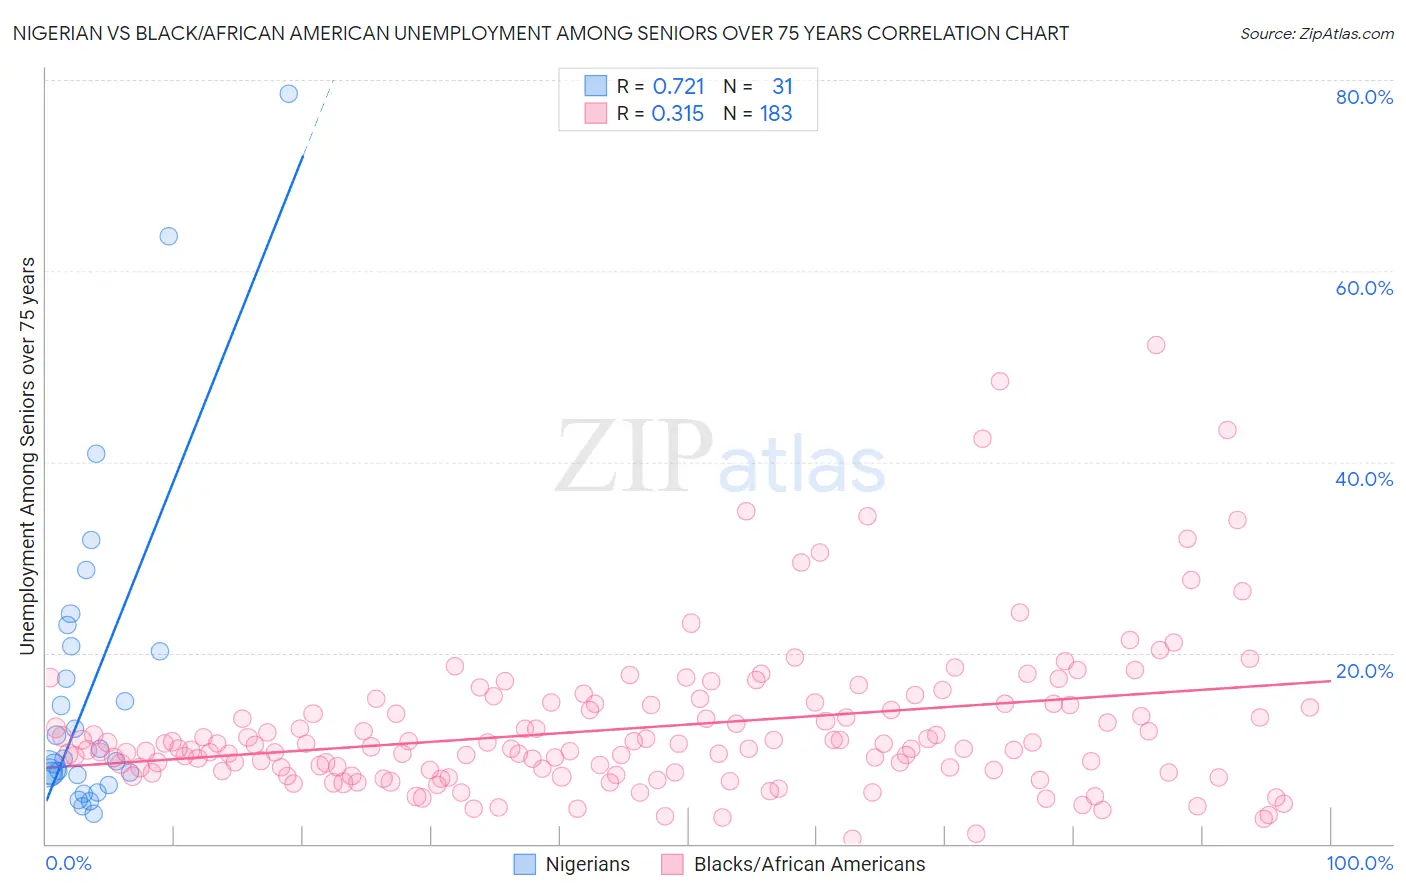
Nigerian vs Black/African American Unemployment Among Seniors over 75 years Correlation Chart
The statistical analysis conducted on geographies consisting of 180,146,882 people shows a strong positive correlation between the proportion of Nigerians and unemployment rate among seniors over the age of 75 in the United States with a correlation coefficient (R) of 0.721 and weighted average of 9.7%. Similarly, the statistical analysis conducted on geographies consisting of 234,580,439 people shows a mild positive correlation between the proportion of Blacks/African Americans and unemployment rate among seniors over the age of 75 in the United States with a correlation coefficient (R) of 0.315 and weighted average of 9.4%, a difference of 3.2%.
Unemployment Among Seniors over 75 years Correlation Summary
| Measurement | Nigerian | Black/African American |
| Minimum | 3.2% | 0.50% |
| Maximum | 78.6% | 52.2% |
| Range | 75.4% | 51.7% |
| Mean | 16.6% | 12.2% |
| Median | 8.9% | 10.2% |
| Interquartile 25% (IQ1) | 7.3% | 7.6% |
| Interquartile 75% (IQ3) | 20.7% | 14.6% |
| Interquartile Range (IQR) | 13.4% | 7.0% |
| Standard Deviation (Sample) | 17.2% | 8.0% |
| Standard Deviation (Population) | 17.0% | 8.0% |
Demographics Similar to Nigerians and Blacks/African Americans by Unemployment Among Seniors over 75 years
In terms of unemployment among seniors over 75 years, the demographic groups most similar to Nigerians are Carpatho Rusyn (9.7%, a difference of 0.060%), European (9.7%, a difference of 0.090%), Immigrants from Nigeria (9.6%, a difference of 0.31%), Macedonian (9.6%, a difference of 0.34%), and Bangladeshi (9.6%, a difference of 0.69%). Similarly, the demographic groups most similar to Blacks/African Americans are Immigrants from Mexico (9.4%, a difference of 0.12%), Greek (9.4%, a difference of 0.28%), Puerto Rican (9.4%, a difference of 0.42%), Yaqui (9.4%, a difference of 0.51%), and Bulgarian (9.4%, a difference of 0.59%).
| Demographics | Rating | Rank | Unemployment Among Seniors over 75 years |
| Blacks/African Americans | 0.5 /100 | #266 | Tragic 9.4% |
| Immigrants | Mexico | 0.4 /100 | #267 | Tragic 9.4% |
| Greeks | 0.4 /100 | #268 | Tragic 9.4% |
| Puerto Ricans | 0.3 /100 | #269 | Tragic 9.4% |
| Yaqui | 0.3 /100 | #270 | Tragic 9.4% |
| Bulgarians | 0.3 /100 | #271 | Tragic 9.4% |
| Immigrants | Iraq | 0.3 /100 | #272 | Tragic 9.4% |
| Czechoslovakians | 0.3 /100 | #273 | Tragic 9.4% |
| Jamaicans | 0.2 /100 | #274 | Tragic 9.5% |
| Senegalese | 0.2 /100 | #275 | Tragic 9.5% |
| Arabs | 0.2 /100 | #276 | Tragic 9.5% |
| Swiss | 0.1 /100 | #277 | Tragic 9.5% |
| Immigrants | Senegal | 0.1 /100 | #278 | Tragic 9.6% |
| British | 0.1 /100 | #279 | Tragic 9.6% |
| Croatians | 0.1 /100 | #280 | Tragic 9.6% |
| Bangladeshis | 0.1 /100 | #281 | Tragic 9.6% |
| Macedonians | 0.0 /100 | #282 | Tragic 9.6% |
| Immigrants | Nigeria | 0.0 /100 | #283 | Tragic 9.6% |
| Europeans | 0.0 /100 | #284 | Tragic 9.7% |
| Carpatho Rusyns | 0.0 /100 | #285 | Tragic 9.7% |
| Nigerians | 0.0 /100 | #286 | Tragic 9.7% |