Nigerian vs Black/African American Single Father Households
COMPARE
Nigerian
Black/African American
Single Father Households
Single Father Households Comparison
Nigerians
Blacks/African Americans
2.4%
SINGLE FATHER HOUSEHOLDS
41.0/ 100
METRIC RATING
185th/ 347
METRIC RANK
2.4%
SINGLE FATHER HOUSEHOLDS
9.7/ 100
METRIC RATING
226th/ 347
METRIC RANK
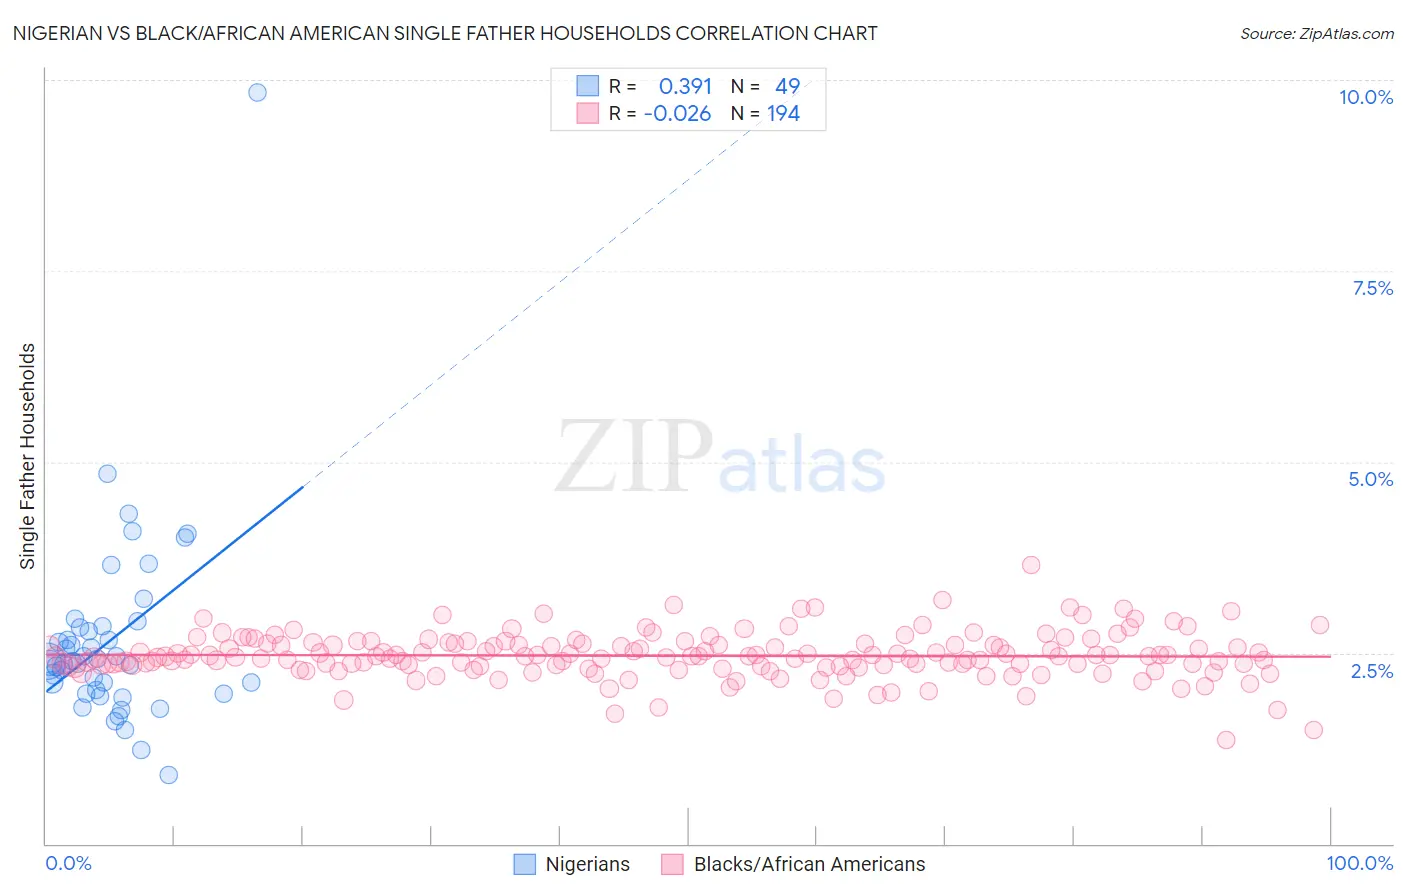
Nigerian vs Black/African American Single Father Households Correlation Chart
The statistical analysis conducted on geographies consisting of 330,825,624 people shows a mild positive correlation between the proportion of Nigerians and percentage of single father households in the United States with a correlation coefficient (R) of 0.391 and weighted average of 2.4%. Similarly, the statistical analysis conducted on geographies consisting of 552,512,239 people shows no correlation between the proportion of Blacks/African Americans and percentage of single father households in the United States with a correlation coefficient (R) of -0.026 and weighted average of 2.4%, a difference of 3.4%.
Single Father Households Correlation Summary
| Measurement | Nigerian | Black/African American |
| Minimum | 0.90% | 1.4% |
| Maximum | 9.8% | 3.7% |
| Range | 8.9% | 2.3% |
| Mean | 2.7% | 2.5% |
| Median | 2.4% | 2.5% |
| Interquartile 25% (IQ1) | 2.0% | 2.3% |
| Interquartile 75% (IQ3) | 2.8% | 2.6% |
| Interquartile Range (IQR) | 0.85% | 0.30% |
| Standard Deviation (Sample) | 1.3% | 0.30% |
| Standard Deviation (Population) | 1.3% | 0.30% |
Similar Demographics by Single Father Households
Demographics Similar to Nigerians by Single Father Households
In terms of single father households, the demographic groups most similar to Nigerians are Immigrants from Bosnia and Herzegovina (2.4%, a difference of 0.050%), Immigrants from Panama (2.4%, a difference of 0.060%), Sri Lankan (2.4%, a difference of 0.060%), Belgian (2.3%, a difference of 0.17%), and Jamaican (2.3%, a difference of 0.18%).
| Demographics | Rating | Rank | Single Father Households |
| Costa Ricans | 44.1 /100 | #178 | Average 2.3% |
| Welsh | 44.0 /100 | #179 | Average 2.3% |
| Yugoslavians | 43.9 /100 | #180 | Average 2.3% |
| Jamaicans | 43.5 /100 | #181 | Average 2.3% |
| Belgians | 43.3 /100 | #182 | Average 2.3% |
| Immigrants | Panama | 41.8 /100 | #183 | Average 2.4% |
| Sri Lankans | 41.8 /100 | #184 | Average 2.4% |
| Nigerians | 41.0 /100 | #185 | Average 2.4% |
| Immigrants | Bosnia and Herzegovina | 40.4 /100 | #186 | Average 2.4% |
| Immigrants | Colombia | 34.0 /100 | #187 | Fair 2.4% |
| Hmong | 33.0 /100 | #188 | Fair 2.4% |
| U.S. Virgin Islanders | 31.8 /100 | #189 | Fair 2.4% |
| French | 31.7 /100 | #190 | Fair 2.4% |
| Immigrants | Africa | 30.0 /100 | #191 | Fair 2.4% |
| Immigrants | Sudan | 29.8 /100 | #192 | Fair 2.4% |
Demographics Similar to Blacks/African Americans by Single Father Households
In terms of single father households, the demographic groups most similar to Blacks/African Americans are Marshallese (2.4%, a difference of 0.010%), American (2.4%, a difference of 0.070%), Immigrants from Ghana (2.4%, a difference of 0.11%), Immigrants from Bahamas (2.4%, a difference of 0.19%), and Immigrants from Zaire (2.4%, a difference of 0.21%).
| Demographics | Rating | Rank | Single Father Households |
| Sudanese | 13.0 /100 | #219 | Poor 2.4% |
| Ghanaians | 12.9 /100 | #220 | Poor 2.4% |
| Immigrants | Burma/Myanmar | 12.1 /100 | #221 | Poor 2.4% |
| Immigrants | Eastern Africa | 11.9 /100 | #222 | Poor 2.4% |
| Immigrants | Uruguay | 11.0 /100 | #223 | Poor 2.4% |
| Immigrants | Bahamas | 10.6 /100 | #224 | Poor 2.4% |
| Marshallese | 9.7 /100 | #225 | Tragic 2.4% |
| Blacks/African Americans | 9.7 /100 | #226 | Tragic 2.4% |
| Americans | 9.3 /100 | #227 | Tragic 2.4% |
| Immigrants | Ghana | 9.1 /100 | #228 | Tragic 2.4% |
| Immigrants | Zaire | 8.6 /100 | #229 | Tragic 2.4% |
| Sub-Saharan Africans | 8.3 /100 | #230 | Tragic 2.4% |
| Immigrants | Nonimmigrants | 7.6 /100 | #231 | Tragic 2.4% |
| Pennsylvania Germans | 7.3 /100 | #232 | Tragic 2.4% |
| Immigrants | Western Africa | 7.0 /100 | #233 | Tragic 2.4% |