Nigerian vs Immigrants from Sweden In Labor Force | Age 35-44
COMPARE
Nigerian
Immigrants from Sweden
In Labor Force | Age 35-44
In Labor Force | Age 35-44 Comparison
Nigerians
Immigrants from Sweden
84.4%
IN LABOR FORCE | AGE 35-44
58.9/ 100
METRIC RATING
164th/ 347
METRIC RANK
84.8%
IN LABOR FORCE | AGE 35-44
95.2/ 100
METRIC RATING
104th/ 347
METRIC RANK
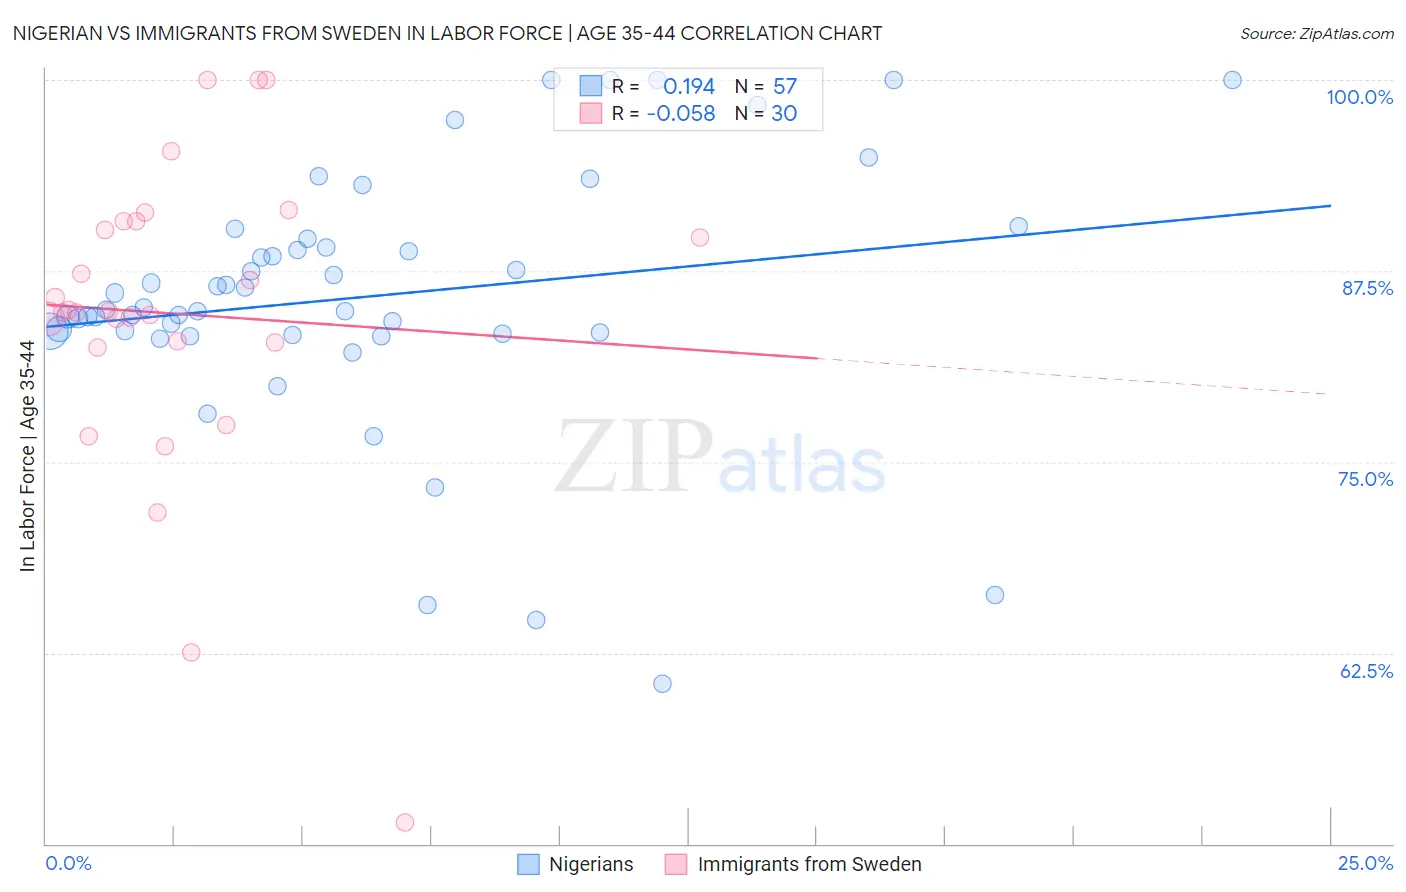
Nigerian vs Immigrants from Sweden In Labor Force | Age 35-44 Correlation Chart
The statistical analysis conducted on geographies consisting of 332,557,673 people shows a poor positive correlation between the proportion of Nigerians and labor force participation rate among population between the ages 35 and 44 in the United States with a correlation coefficient (R) of 0.194 and weighted average of 84.4%. Similarly, the statistical analysis conducted on geographies consisting of 164,707,751 people shows a slight negative correlation between the proportion of Immigrants from Sweden and labor force participation rate among population between the ages 35 and 44 in the United States with a correlation coefficient (R) of -0.058 and weighted average of 84.8%, a difference of 0.42%.
In Labor Force | Age 35-44 Correlation Summary
| Measurement | Nigerian | Immigrants from Sweden |
| Minimum | 60.5% | 51.4% |
| Maximum | 100.0% | 100.0% |
| Range | 39.5% | 48.6% |
| Mean | 85.8% | 84.7% |
| Median | 85.0% | 84.8% |
| Interquartile 25% (IQ1) | 83.4% | 82.8% |
| Interquartile 75% (IQ3) | 89.3% | 90.8% |
| Interquartile Range (IQR) | 5.9% | 7.9% |
| Standard Deviation (Sample) | 8.4% | 10.2% |
| Standard Deviation (Population) | 8.3% | 10.0% |
Similar Demographics by In Labor Force | Age 35-44
Demographics Similar to Nigerians by In Labor Force | Age 35-44
In terms of in labor force | age 35-44, the demographic groups most similar to Nigerians are Immigrants from Hungary (84.4%, a difference of 0.0%), Aleut (84.4%, a difference of 0.0%), Immigrants from Senegal (84.4%, a difference of 0.010%), Immigrants from Kazakhstan (84.4%, a difference of 0.010%), and Immigrants from Venezuela (84.4%, a difference of 0.010%).
| Demographics | Rating | Rank | In Labor Force | Age 35-44 |
| Immigrants | Austria | 63.8 /100 | #157 | Good 84.4% |
| Jamaicans | 62.7 /100 | #158 | Good 84.4% |
| Immigrants | Senegal | 60.4 /100 | #159 | Good 84.4% |
| Immigrants | Kazakhstan | 60.4 /100 | #160 | Good 84.4% |
| Immigrants | Venezuela | 60.0 /100 | #161 | Good 84.4% |
| Immigrants | Hungary | 59.4 /100 | #162 | Average 84.4% |
| Aleuts | 59.1 /100 | #163 | Average 84.4% |
| Nigerians | 58.9 /100 | #164 | Average 84.4% |
| Venezuelans | 58.1 /100 | #165 | Average 84.4% |
| Alsatians | 55.2 /100 | #166 | Average 84.4% |
| Immigrants | Portugal | 55.2 /100 | #167 | Average 84.4% |
| Irish | 53.1 /100 | #168 | Average 84.4% |
| Immigrants | Afghanistan | 52.7 /100 | #169 | Average 84.4% |
| Immigrants | Jordan | 52.5 /100 | #170 | Average 84.4% |
| Jordanians | 51.7 /100 | #171 | Average 84.4% |
Demographics Similar to Immigrants from Sweden by In Labor Force | Age 35-44
In terms of in labor force | age 35-44, the demographic groups most similar to Immigrants from Sweden are Immigrants from Southern Europe (84.8%, a difference of 0.0%), Immigrants from Belarus (84.8%, a difference of 0.0%), Immigrants from Australia (84.8%, a difference of 0.010%), South American (84.8%, a difference of 0.010%), and Immigrants from Bahamas (84.8%, a difference of 0.010%).
| Demographics | Rating | Rank | In Labor Force | Age 35-44 |
| Egyptians | 96.6 /100 | #97 | Exceptional 84.8% |
| Indians (Asian) | 96.1 /100 | #98 | Exceptional 84.8% |
| Haitians | 96.0 /100 | #99 | Exceptional 84.8% |
| Immigrants | Czechoslovakia | 95.9 /100 | #100 | Exceptional 84.8% |
| Immigrants | Australia | 95.5 /100 | #101 | Exceptional 84.8% |
| Immigrants | Southern Europe | 95.3 /100 | #102 | Exceptional 84.8% |
| Immigrants | Belarus | 95.3 /100 | #103 | Exceptional 84.8% |
| Immigrants | Sweden | 95.2 /100 | #104 | Exceptional 84.8% |
| South Americans | 95.0 /100 | #105 | Exceptional 84.8% |
| Immigrants | Bahamas | 94.8 /100 | #106 | Exceptional 84.8% |
| Immigrants | Romania | 94.7 /100 | #107 | Exceptional 84.8% |
| Immigrants | Argentina | 94.5 /100 | #108 | Exceptional 84.8% |
| Immigrants | Russia | 94.5 /100 | #109 | Exceptional 84.8% |
| Filipinos | 93.8 /100 | #110 | Exceptional 84.7% |
| Ukrainians | 93.5 /100 | #111 | Exceptional 84.7% |