Sri Lankan vs Immigrants from Sweden In Labor Force | Age 35-44
COMPARE
Sri Lankan
Immigrants from Sweden
In Labor Force | Age 35-44
In Labor Force | Age 35-44 Comparison
Sri Lankans
Immigrants from Sweden
84.4%
IN LABOR FORCE | AGE 35-44
47.3/ 100
METRIC RATING
176th/ 347
METRIC RANK
84.8%
IN LABOR FORCE | AGE 35-44
95.2/ 100
METRIC RATING
104th/ 347
METRIC RANK
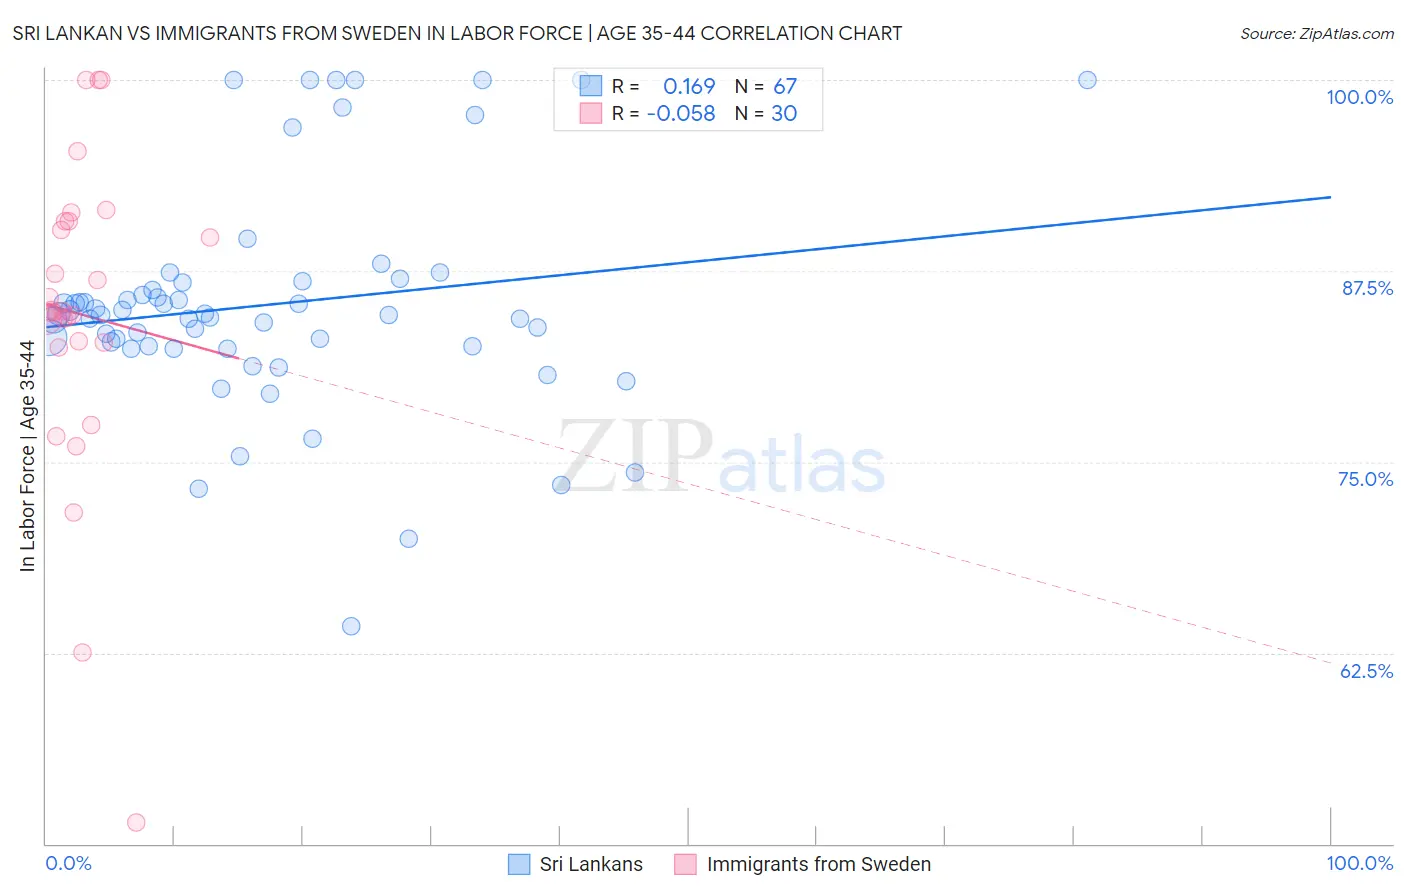
Sri Lankan vs Immigrants from Sweden In Labor Force | Age 35-44 Correlation Chart
The statistical analysis conducted on geographies consisting of 440,223,389 people shows a poor positive correlation between the proportion of Sri Lankans and labor force participation rate among population between the ages 35 and 44 in the United States with a correlation coefficient (R) of 0.169 and weighted average of 84.4%. Similarly, the statistical analysis conducted on geographies consisting of 164,707,751 people shows a slight negative correlation between the proportion of Immigrants from Sweden and labor force participation rate among population between the ages 35 and 44 in the United States with a correlation coefficient (R) of -0.058 and weighted average of 84.8%, a difference of 0.50%.
In Labor Force | Age 35-44 Correlation Summary
| Measurement | Sri Lankan | Immigrants from Sweden |
| Minimum | 64.2% | 51.4% |
| Maximum | 100.0% | 100.0% |
| Range | 35.8% | 48.6% |
| Mean | 85.3% | 84.7% |
| Median | 84.6% | 84.8% |
| Interquartile 25% (IQ1) | 82.6% | 82.8% |
| Interquartile 75% (IQ3) | 86.7% | 90.8% |
| Interquartile Range (IQR) | 4.1% | 7.9% |
| Standard Deviation (Sample) | 7.3% | 10.2% |
| Standard Deviation (Population) | 7.2% | 10.0% |
Similar Demographics by In Labor Force | Age 35-44
Demographics Similar to Sri Lankans by In Labor Force | Age 35-44
In terms of in labor force | age 35-44, the demographic groups most similar to Sri Lankans are Pakistani (84.4%, a difference of 0.010%), Immigrants from Trinidad and Tobago (84.4%, a difference of 0.020%), Immigrants from Iran (84.4%, a difference of 0.020%), French Canadian (84.3%, a difference of 0.020%), and Northern European (84.3%, a difference of 0.020%).
| Demographics | Rating | Rank | In Labor Force | Age 35-44 |
| Immigrants | Afghanistan | 52.7 /100 | #169 | Average 84.4% |
| Immigrants | Jordan | 52.5 /100 | #170 | Average 84.4% |
| Jordanians | 51.7 /100 | #171 | Average 84.4% |
| Scandinavians | 51.2 /100 | #172 | Average 84.4% |
| Immigrants | Trinidad and Tobago | 50.7 /100 | #173 | Average 84.4% |
| Immigrants | Iran | 50.0 /100 | #174 | Average 84.4% |
| Pakistanis | 48.2 /100 | #175 | Average 84.4% |
| Sri Lankans | 47.3 /100 | #176 | Average 84.4% |
| French Canadians | 44.3 /100 | #177 | Average 84.3% |
| Northern Europeans | 44.1 /100 | #178 | Average 84.3% |
| Immigrants | South Africa | 42.8 /100 | #179 | Average 84.3% |
| Danes | 38.8 /100 | #180 | Fair 84.3% |
| Immigrants | West Indies | 36.4 /100 | #181 | Fair 84.3% |
| Koreans | 36.3 /100 | #182 | Fair 84.3% |
| Barbadians | 36.2 /100 | #183 | Fair 84.3% |
Demographics Similar to Immigrants from Sweden by In Labor Force | Age 35-44
In terms of in labor force | age 35-44, the demographic groups most similar to Immigrants from Sweden are Immigrants from Southern Europe (84.8%, a difference of 0.0%), Immigrants from Belarus (84.8%, a difference of 0.0%), Immigrants from Australia (84.8%, a difference of 0.010%), South American (84.8%, a difference of 0.010%), and Immigrants from Bahamas (84.8%, a difference of 0.010%).
| Demographics | Rating | Rank | In Labor Force | Age 35-44 |
| Egyptians | 96.6 /100 | #97 | Exceptional 84.8% |
| Indians (Asian) | 96.1 /100 | #98 | Exceptional 84.8% |
| Haitians | 96.0 /100 | #99 | Exceptional 84.8% |
| Immigrants | Czechoslovakia | 95.9 /100 | #100 | Exceptional 84.8% |
| Immigrants | Australia | 95.5 /100 | #101 | Exceptional 84.8% |
| Immigrants | Southern Europe | 95.3 /100 | #102 | Exceptional 84.8% |
| Immigrants | Belarus | 95.3 /100 | #103 | Exceptional 84.8% |
| Immigrants | Sweden | 95.2 /100 | #104 | Exceptional 84.8% |
| South Americans | 95.0 /100 | #105 | Exceptional 84.8% |
| Immigrants | Bahamas | 94.8 /100 | #106 | Exceptional 84.8% |
| Immigrants | Romania | 94.7 /100 | #107 | Exceptional 84.8% |
| Immigrants | Argentina | 94.5 /100 | #108 | Exceptional 84.8% |
| Immigrants | Russia | 94.5 /100 | #109 | Exceptional 84.8% |
| Filipinos | 93.8 /100 | #110 | Exceptional 84.7% |
| Ukrainians | 93.5 /100 | #111 | Exceptional 84.7% |