Immigrants from Asia vs Potawatomi In Labor Force | Age 45-54
COMPARE
Immigrants from Asia
Potawatomi
In Labor Force | Age 45-54
In Labor Force | Age 45-54 Comparison
Immigrants from Asia
Potawatomi
83.3%
IN LABOR FORCE | AGE 45-54
95.6/ 100
METRIC RATING
88th/ 347
METRIC RANK
80.0%
IN LABOR FORCE | AGE 45-54
0.0/ 100
METRIC RATING
309th/ 347
METRIC RANK
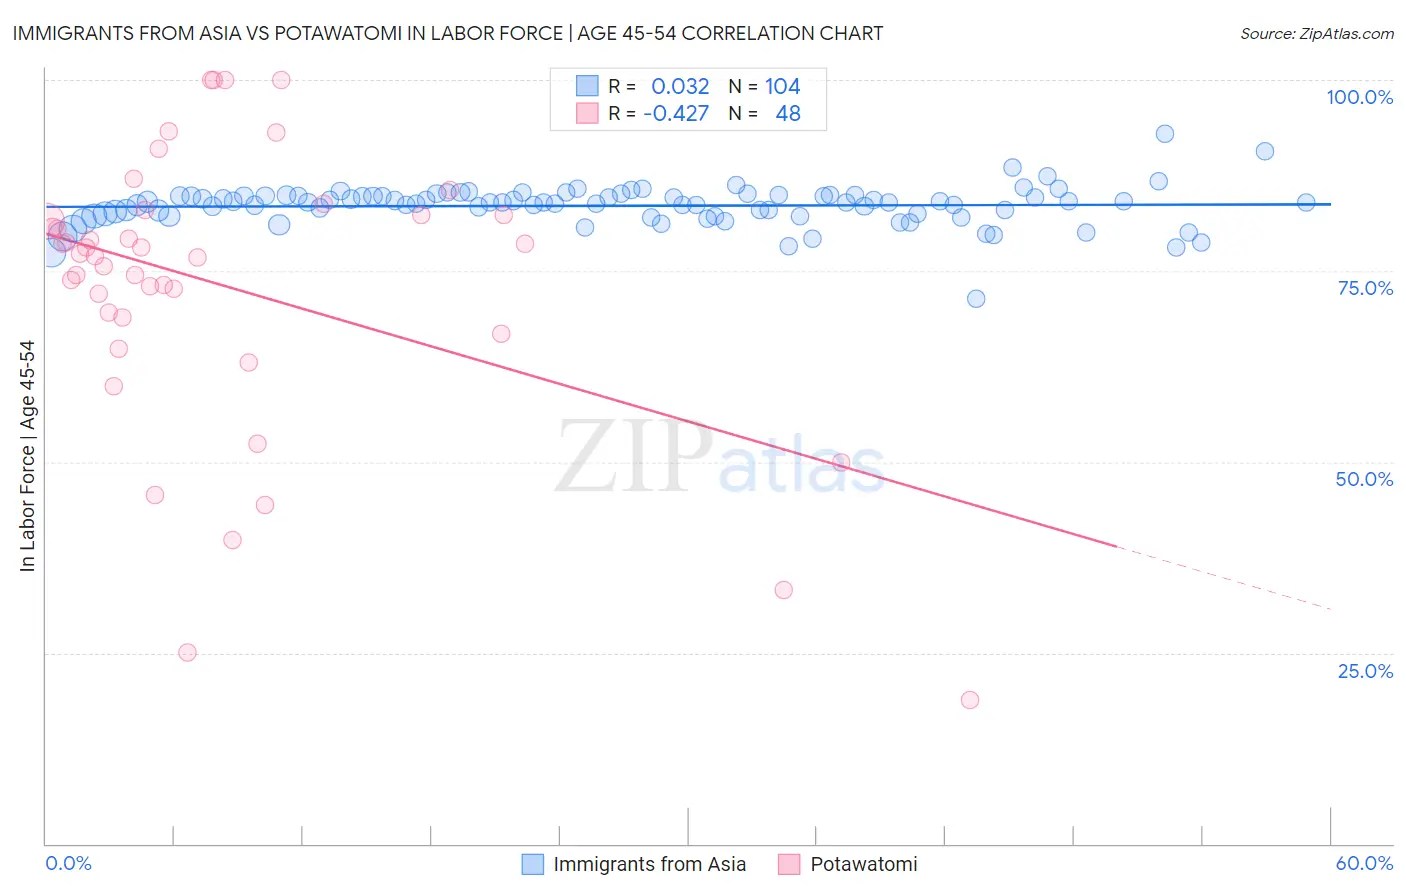
Immigrants from Asia vs Potawatomi In Labor Force | Age 45-54 Correlation Chart
The statistical analysis conducted on geographies consisting of 548,472,608 people shows no correlation between the proportion of Immigrants from Asia and labor force participation rate among population between the ages 45 and 54 in the United States with a correlation coefficient (R) of 0.032 and weighted average of 83.3%. Similarly, the statistical analysis conducted on geographies consisting of 117,759,317 people shows a moderate negative correlation between the proportion of Potawatomi and labor force participation rate among population between the ages 45 and 54 in the United States with a correlation coefficient (R) of -0.427 and weighted average of 80.0%, a difference of 4.2%.
In Labor Force | Age 45-54 Correlation Summary
| Measurement | Immigrants from Asia | Potawatomi |
| Minimum | 71.4% | 18.8% |
| Maximum | 92.9% | 100.0% |
| Range | 21.5% | 81.2% |
| Mean | 83.5% | 72.9% |
| Median | 84.0% | 77.1% |
| Interquartile 25% (IQ1) | 82.3% | 67.9% |
| Interquartile 75% (IQ3) | 84.8% | 82.4% |
| Interquartile Range (IQR) | 2.5% | 14.5% |
| Standard Deviation (Sample) | 2.6% | 18.5% |
| Standard Deviation (Population) | 2.6% | 18.3% |
Similar Demographics by In Labor Force | Age 45-54
Demographics Similar to Immigrants from Asia by In Labor Force | Age 45-54
In terms of in labor force | age 45-54, the demographic groups most similar to Immigrants from Asia are Immigrants from Eastern Europe (83.3%, a difference of 0.0%), Indian (Asian) (83.3%, a difference of 0.0%), Immigrants from Japan (83.3%, a difference of 0.0%), South American (83.3%, a difference of 0.0%), and Immigrants from Northern Africa (83.3%, a difference of 0.010%).
| Demographics | Rating | Rank | In Labor Force | Age 45-54 |
| Jordanians | 96.4 /100 | #81 | Exceptional 83.4% |
| Immigrants | Eastern Asia | 96.3 /100 | #82 | Exceptional 83.4% |
| Immigrants | Zimbabwe | 96.3 /100 | #83 | Exceptional 83.4% |
| Immigrants | Bosnia and Herzegovina | 96.0 /100 | #84 | Exceptional 83.3% |
| Greeks | 95.9 /100 | #85 | Exceptional 83.3% |
| Immigrants | Northern Africa | 95.7 /100 | #86 | Exceptional 83.3% |
| Immigrants | Eastern Europe | 95.6 /100 | #87 | Exceptional 83.3% |
| Immigrants | Asia | 95.6 /100 | #88 | Exceptional 83.3% |
| Indians (Asian) | 95.5 /100 | #89 | Exceptional 83.3% |
| Immigrants | Japan | 95.5 /100 | #90 | Exceptional 83.3% |
| South Americans | 95.5 /100 | #91 | Exceptional 83.3% |
| Danes | 95.3 /100 | #92 | Exceptional 83.3% |
| Italians | 95.1 /100 | #93 | Exceptional 83.3% |
| Argentineans | 94.9 /100 | #94 | Exceptional 83.3% |
| Immigrants | Argentina | 94.9 /100 | #95 | Exceptional 83.3% |
Demographics Similar to Potawatomi by In Labor Force | Age 45-54
In terms of in labor force | age 45-54, the demographic groups most similar to Potawatomi are Central American Indian (80.0%, a difference of 0.030%), Blackfeet (80.0%, a difference of 0.070%), Inupiat (79.9%, a difference of 0.090%), Spanish American (80.1%, a difference of 0.14%), and Immigrants from Dominican Republic (80.1%, a difference of 0.18%).
| Demographics | Rating | Rank | In Labor Force | Age 45-54 |
| Immigrants | Central America | 0.0 /100 | #302 | Tragic 80.2% |
| Immigrants | Azores | 0.0 /100 | #303 | Tragic 80.1% |
| Hispanics or Latinos | 0.0 /100 | #304 | Tragic 80.1% |
| Immigrants | Dominican Republic | 0.0 /100 | #305 | Tragic 80.1% |
| Spanish Americans | 0.0 /100 | #306 | Tragic 80.1% |
| Blackfeet | 0.0 /100 | #307 | Tragic 80.0% |
| Central American Indians | 0.0 /100 | #308 | Tragic 80.0% |
| Potawatomi | 0.0 /100 | #309 | Tragic 80.0% |
| Inupiat | 0.0 /100 | #310 | Tragic 79.9% |
| Mexicans | 0.0 /100 | #311 | Tragic 79.8% |
| Immigrants | Mexico | 0.0 /100 | #312 | Tragic 79.7% |
| Colville | 0.0 /100 | #313 | Tragic 79.5% |
| Ottawa | 0.0 /100 | #314 | Tragic 79.5% |
| Blacks/African Americans | 0.0 /100 | #315 | Tragic 79.3% |
| Shoshone | 0.0 /100 | #316 | Tragic 79.3% |