Luxembourger vs Potawatomi In Labor Force | Age 45-54
COMPARE
Luxembourger
Potawatomi
In Labor Force | Age 45-54
In Labor Force | Age 45-54 Comparison
Luxembourgers
Potawatomi
85.0%
IN LABOR FORCE | AGE 45-54
100.0/ 100
METRIC RATING
2nd/ 347
METRIC RANK
80.0%
IN LABOR FORCE | AGE 45-54
0.0/ 100
METRIC RATING
309th/ 347
METRIC RANK
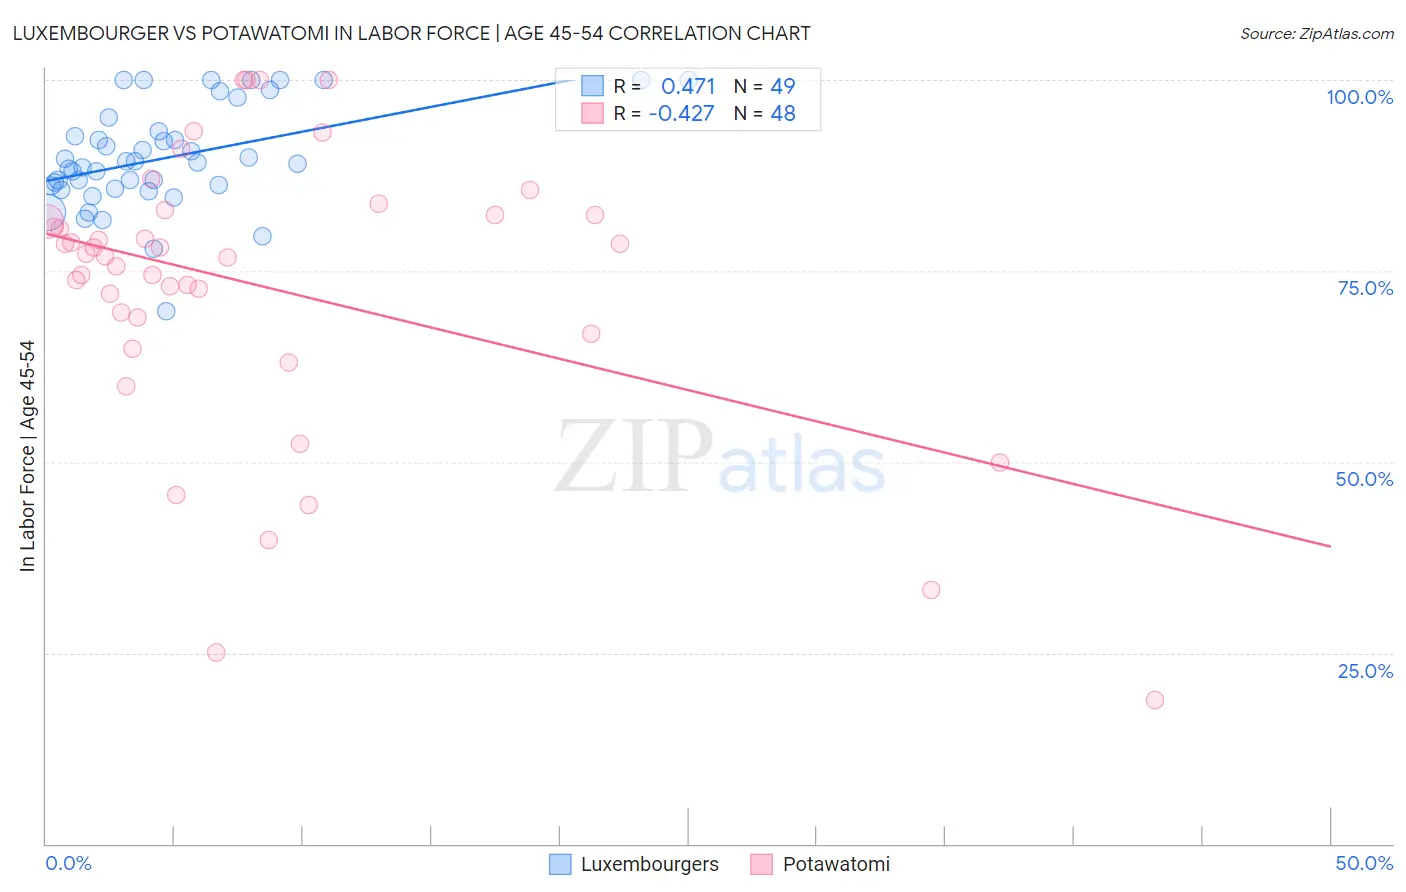
Luxembourger vs Potawatomi In Labor Force | Age 45-54 Correlation Chart
The statistical analysis conducted on geographies consisting of 144,640,644 people shows a moderate positive correlation between the proportion of Luxembourgers and labor force participation rate among population between the ages 45 and 54 in the United States with a correlation coefficient (R) of 0.471 and weighted average of 85.0%. Similarly, the statistical analysis conducted on geographies consisting of 117,759,317 people shows a moderate negative correlation between the proportion of Potawatomi and labor force participation rate among population between the ages 45 and 54 in the United States with a correlation coefficient (R) of -0.427 and weighted average of 80.0%, a difference of 6.3%.
In Labor Force | Age 45-54 Correlation Summary
| Measurement | Luxembourger | Potawatomi |
| Minimum | 69.6% | 18.8% |
| Maximum | 100.0% | 100.0% |
| Range | 30.4% | 81.2% |
| Mean | 89.9% | 72.9% |
| Median | 89.2% | 77.1% |
| Interquartile 25% (IQ1) | 85.9% | 67.9% |
| Interquartile 75% (IQ3) | 94.1% | 82.4% |
| Interquartile Range (IQR) | 8.2% | 14.5% |
| Standard Deviation (Sample) | 6.8% | 18.5% |
| Standard Deviation (Population) | 6.7% | 18.3% |
Similar Demographics by In Labor Force | Age 45-54
Demographics Similar to Luxembourgers by In Labor Force | Age 45-54
In terms of in labor force | age 45-54, the demographic groups most similar to Luxembourgers are Bolivian (84.9%, a difference of 0.090%), Immigrants from Ethiopia (84.8%, a difference of 0.21%), Ethiopian (84.8%, a difference of 0.29%), Immigrants from Bolivia (85.3%, a difference of 0.34%), and Immigrants from India (84.7%, a difference of 0.40%).
| Demographics | Rating | Rank | In Labor Force | Age 45-54 |
| Immigrants | Bolivia | 100.0 /100 | #1 | Exceptional 85.3% |
| Luxembourgers | 100.0 /100 | #2 | Exceptional 85.0% |
| Bolivians | 100.0 /100 | #3 | Exceptional 84.9% |
| Immigrants | Ethiopia | 100.0 /100 | #4 | Exceptional 84.8% |
| Ethiopians | 100.0 /100 | #5 | Exceptional 84.8% |
| Immigrants | India | 100.0 /100 | #6 | Exceptional 84.7% |
| Immigrants | Cameroon | 100.0 /100 | #7 | Exceptional 84.6% |
| Sierra Leoneans | 100.0 /100 | #8 | Exceptional 84.5% |
| Immigrants | Sierra Leone | 100.0 /100 | #9 | Exceptional 84.4% |
| Norwegians | 100.0 /100 | #10 | Exceptional 84.4% |
| Thais | 100.0 /100 | #11 | Exceptional 84.3% |
| Bulgarians | 100.0 /100 | #12 | Exceptional 84.2% |
| Chinese | 99.9 /100 | #13 | Exceptional 84.1% |
| Cambodians | 99.9 /100 | #14 | Exceptional 84.1% |
| Cypriots | 99.9 /100 | #15 | Exceptional 84.1% |
Demographics Similar to Potawatomi by In Labor Force | Age 45-54
In terms of in labor force | age 45-54, the demographic groups most similar to Potawatomi are Central American Indian (80.0%, a difference of 0.030%), Blackfeet (80.0%, a difference of 0.070%), Inupiat (79.9%, a difference of 0.090%), Spanish American (80.1%, a difference of 0.14%), and Immigrants from Dominican Republic (80.1%, a difference of 0.18%).
| Demographics | Rating | Rank | In Labor Force | Age 45-54 |
| Immigrants | Central America | 0.0 /100 | #302 | Tragic 80.2% |
| Immigrants | Azores | 0.0 /100 | #303 | Tragic 80.1% |
| Hispanics or Latinos | 0.0 /100 | #304 | Tragic 80.1% |
| Immigrants | Dominican Republic | 0.0 /100 | #305 | Tragic 80.1% |
| Spanish Americans | 0.0 /100 | #306 | Tragic 80.1% |
| Blackfeet | 0.0 /100 | #307 | Tragic 80.0% |
| Central American Indians | 0.0 /100 | #308 | Tragic 80.0% |
| Potawatomi | 0.0 /100 | #309 | Tragic 80.0% |
| Inupiat | 0.0 /100 | #310 | Tragic 79.9% |
| Mexicans | 0.0 /100 | #311 | Tragic 79.8% |
| Immigrants | Mexico | 0.0 /100 | #312 | Tragic 79.7% |
| Colville | 0.0 /100 | #313 | Tragic 79.5% |
| Ottawa | 0.0 /100 | #314 | Tragic 79.5% |
| Blacks/African Americans | 0.0 /100 | #315 | Tragic 79.3% |
| Shoshone | 0.0 /100 | #316 | Tragic 79.3% |