Nepalese vs Immigrants from Indonesia In Labor Force | Age 45-54
COMPARE
Nepalese
Immigrants from Indonesia
In Labor Force | Age 45-54
In Labor Force | Age 45-54 Comparison
Nepalese
Immigrants from Indonesia
80.5%
IN LABOR FORCE | AGE 45-54
0.0/ 100
METRIC RATING
295th/ 347
METRIC RANK
82.9%
IN LABOR FORCE | AGE 45-54
70.6/ 100
METRIC RATING
153rd/ 347
METRIC RANK
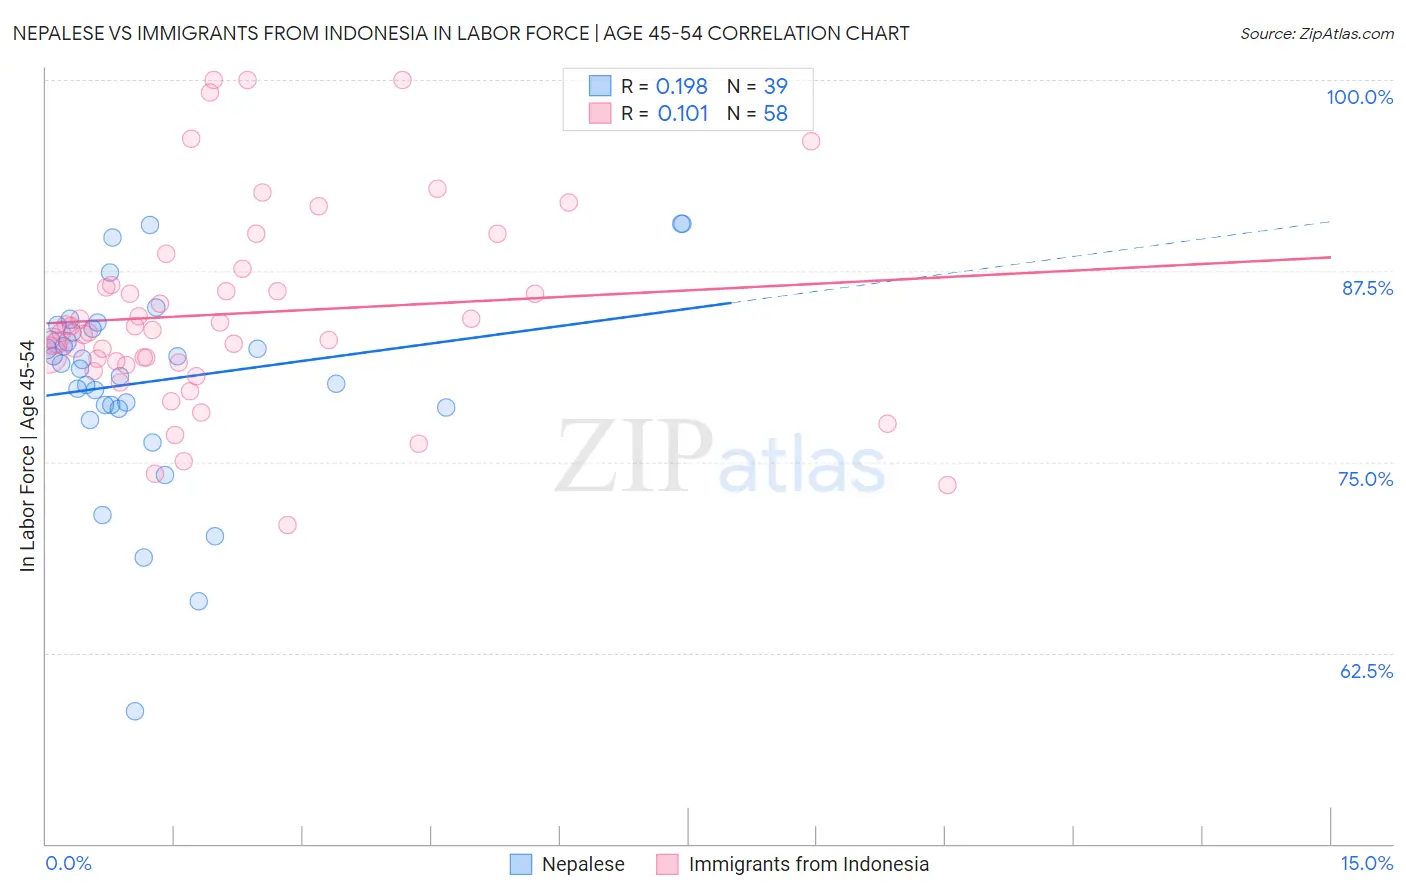
Nepalese vs Immigrants from Indonesia In Labor Force | Age 45-54 Correlation Chart
The statistical analysis conducted on geographies consisting of 24,500,920 people shows a poor positive correlation between the proportion of Nepalese and labor force participation rate among population between the ages 45 and 54 in the United States with a correlation coefficient (R) of 0.198 and weighted average of 80.5%. Similarly, the statistical analysis conducted on geographies consisting of 215,716,798 people shows a poor positive correlation between the proportion of Immigrants from Indonesia and labor force participation rate among population between the ages 45 and 54 in the United States with a correlation coefficient (R) of 0.101 and weighted average of 82.9%, a difference of 2.9%.
In Labor Force | Age 45-54 Correlation Summary
| Measurement | Nepalese | Immigrants from Indonesia |
| Minimum | 58.7% | 70.9% |
| Maximum | 90.6% | 100.0% |
| Range | 31.9% | 29.1% |
| Mean | 80.3% | 84.7% |
| Median | 81.4% | 83.6% |
| Interquartile 25% (IQ1) | 78.6% | 81.5% |
| Interquartile 75% (IQ3) | 83.7% | 86.6% |
| Interquartile Range (IQR) | 5.1% | 5.1% |
| Standard Deviation (Sample) | 6.6% | 6.6% |
| Standard Deviation (Population) | 6.5% | 6.5% |
Similar Demographics by In Labor Force | Age 45-54
Demographics Similar to Nepalese by In Labor Force | Age 45-54
In terms of in labor force | age 45-54, the demographic groups most similar to Nepalese are African (80.5%, a difference of 0.040%), Osage (80.6%, a difference of 0.070%), Yakama (80.6%, a difference of 0.070%), Iroquois (80.6%, a difference of 0.090%), and Immigrants from Belize (80.6%, a difference of 0.12%).
| Demographics | Rating | Rank | In Labor Force | Age 45-54 |
| Cree | 0.0 /100 | #288 | Tragic 80.8% |
| Immigrants | Bangladesh | 0.0 /100 | #289 | Tragic 80.7% |
| Mexican American Indians | 0.0 /100 | #290 | Tragic 80.7% |
| Immigrants | Belize | 0.0 /100 | #291 | Tragic 80.6% |
| Iroquois | 0.0 /100 | #292 | Tragic 80.6% |
| Osage | 0.0 /100 | #293 | Tragic 80.6% |
| Yakama | 0.0 /100 | #294 | Tragic 80.6% |
| Nepalese | 0.0 /100 | #295 | Tragic 80.5% |
| Africans | 0.0 /100 | #296 | Tragic 80.5% |
| Americans | 0.0 /100 | #297 | Tragic 80.4% |
| Marshallese | 0.0 /100 | #298 | Tragic 80.3% |
| Dominicans | 0.0 /100 | #299 | Tragic 80.3% |
| Fijians | 0.0 /100 | #300 | Tragic 80.2% |
| Spanish American Indians | 0.0 /100 | #301 | Tragic 80.2% |
| Immigrants | Central America | 0.0 /100 | #302 | Tragic 80.2% |
Demographics Similar to Immigrants from Indonesia by In Labor Force | Age 45-54
In terms of in labor force | age 45-54, the demographic groups most similar to Immigrants from Indonesia are Immigrants from Ghana (82.9%, a difference of 0.0%), Korean (82.9%, a difference of 0.010%), Slavic (82.9%, a difference of 0.010%), Immigrants from Netherlands (82.9%, a difference of 0.020%), and Immigrants from Philippines (82.9%, a difference of 0.020%).
| Demographics | Rating | Rank | In Labor Force | Age 45-54 |
| Immigrants | France | 75.3 /100 | #146 | Good 83.0% |
| Czechoslovakians | 74.8 /100 | #147 | Good 83.0% |
| Immigrants | Nigeria | 74.1 /100 | #148 | Good 83.0% |
| Immigrants | Sweden | 73.3 /100 | #149 | Good 82.9% |
| Immigrants | Netherlands | 72.6 /100 | #150 | Good 82.9% |
| Koreans | 71.9 /100 | #151 | Good 82.9% |
| Slavs | 71.5 /100 | #152 | Good 82.9% |
| Immigrants | Indonesia | 70.6 /100 | #153 | Good 82.9% |
| Immigrants | Ghana | 70.3 /100 | #154 | Good 82.9% |
| Immigrants | Philippines | 69.0 /100 | #155 | Good 82.9% |
| Immigrants | Saudi Arabia | 68.8 /100 | #156 | Good 82.9% |
| Immigrants | Australia | 68.2 /100 | #157 | Good 82.9% |
| Immigrants | Southern Europe | 67.8 /100 | #158 | Good 82.9% |
| Immigrants | Austria | 64.6 /100 | #159 | Good 82.9% |
| Laotians | 62.8 /100 | #160 | Good 82.9% |