Navajo vs Lebanese In Labor Force | Age 25-29
COMPARE
Navajo
Lebanese
In Labor Force | Age 25-29
In Labor Force | Age 25-29 Comparison
Navajo
Lebanese
74.6%
IN LABOR FORCE | AGE 25-29
0.0/ 100
METRIC RATING
345th/ 347
METRIC RANK
84.3%
IN LABOR FORCE | AGE 25-29
11.1/ 100
METRIC RATING
214th/ 347
METRIC RANK
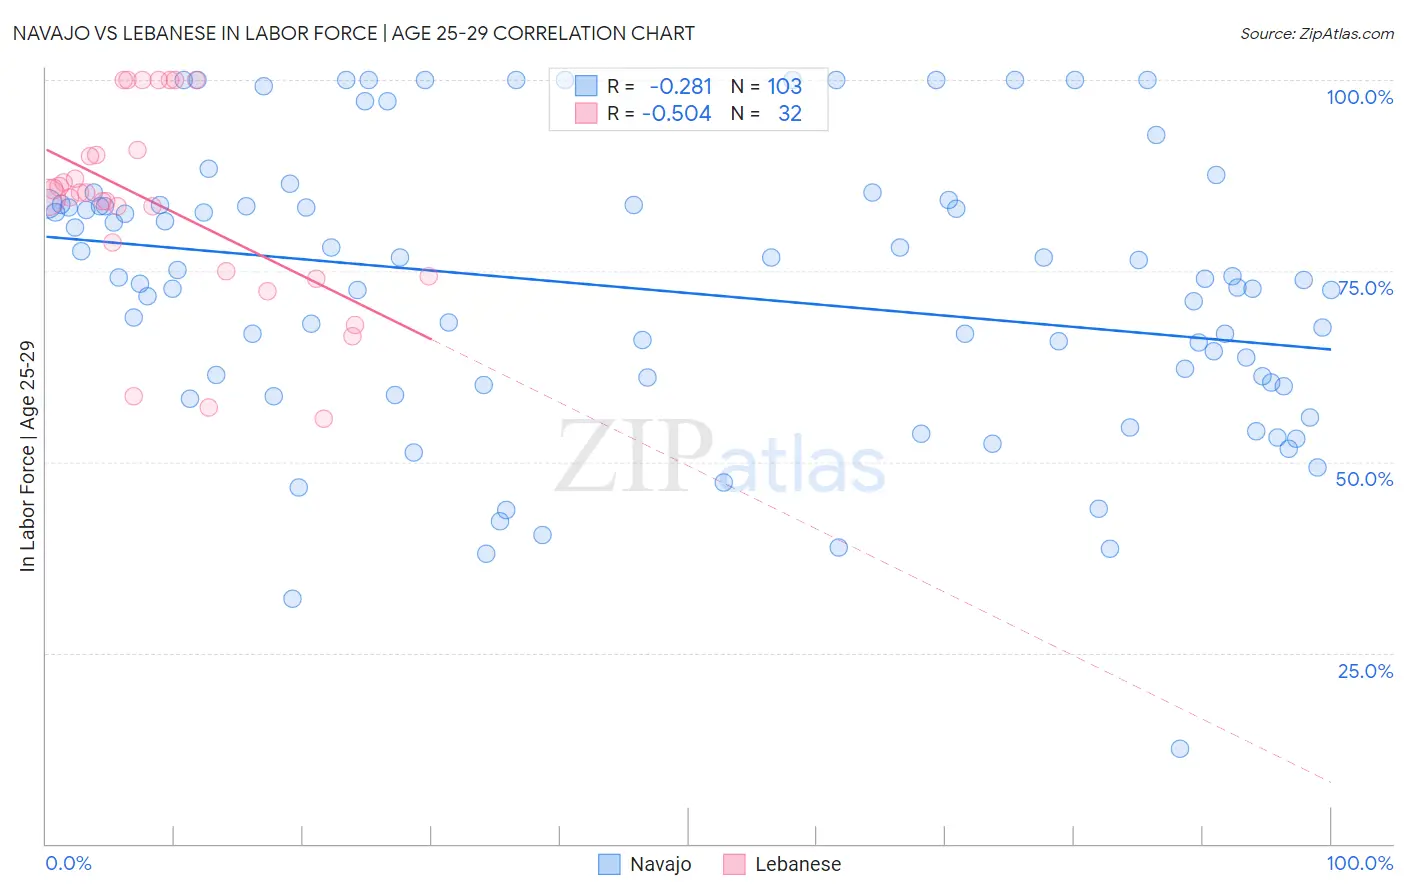
Navajo vs Lebanese In Labor Force | Age 25-29 Correlation Chart
The statistical analysis conducted on geographies consisting of 224,779,280 people shows a weak negative correlation between the proportion of Navajo and labor force participation rate among population between the ages 25 and 29 in the United States with a correlation coefficient (R) of -0.281 and weighted average of 74.6%. Similarly, the statistical analysis conducted on geographies consisting of 401,455,455 people shows a substantial negative correlation between the proportion of Lebanese and labor force participation rate among population between the ages 25 and 29 in the United States with a correlation coefficient (R) of -0.504 and weighted average of 84.3%, a difference of 13.0%.
In Labor Force | Age 25-29 Correlation Summary
| Measurement | Navajo | Lebanese |
| Minimum | 12.5% | 55.6% |
| Maximum | 100.0% | 100.0% |
| Range | 87.5% | 44.4% |
| Mean | 72.4% | 83.5% |
| Median | 73.9% | 84.9% |
| Interquartile 25% (IQ1) | 60.0% | 74.7% |
| Interquartile 75% (IQ3) | 83.7% | 90.5% |
| Interquartile Range (IQR) | 23.7% | 15.9% |
| Standard Deviation (Sample) | 18.5% | 12.8% |
| Standard Deviation (Population) | 18.4% | 12.6% |
Similar Demographics by In Labor Force | Age 25-29
Demographics Similar to Navajo by In Labor Force | Age 25-29
In terms of in labor force | age 25-29, the demographic groups most similar to Navajo are Pima (74.3%, a difference of 0.48%), Yup'ik (73.1%, a difference of 2.2%), Hopi (76.5%, a difference of 2.5%), Arapaho (76.6%, a difference of 2.6%), and Pueblo (77.5%, a difference of 3.8%).
| Demographics | Rating | Rank | In Labor Force | Age 25-29 |
| Sioux | 0.0 /100 | #333 | Tragic 79.7% |
| Yuman | 0.0 /100 | #334 | Tragic 79.3% |
| Natives/Alaskans | 0.0 /100 | #335 | Tragic 79.3% |
| Apache | 0.0 /100 | #336 | Tragic 79.2% |
| Crow | 0.0 /100 | #337 | Tragic 78.6% |
| Lumbee | 0.0 /100 | #338 | Tragic 78.3% |
| Immigrants | Yemen | 0.0 /100 | #339 | Tragic 78.2% |
| Paiute | 0.0 /100 | #340 | Tragic 78.1% |
| Tohono O'odham | 0.0 /100 | #341 | Tragic 77.5% |
| Pueblo | 0.0 /100 | #342 | Tragic 77.5% |
| Arapaho | 0.0 /100 | #343 | Tragic 76.6% |
| Hopi | 0.0 /100 | #344 | Tragic 76.5% |
| Navajo | 0.0 /100 | #345 | Tragic 74.6% |
| Pima | 0.0 /100 | #346 | Tragic 74.3% |
| Yup'ik | 0.0 /100 | #347 | Tragic 73.1% |
Demographics Similar to Lebanese by In Labor Force | Age 25-29
In terms of in labor force | age 25-29, the demographic groups most similar to Lebanese are Subsaharan African (84.3%, a difference of 0.010%), Japanese (84.3%, a difference of 0.010%), Immigrants from Syria (84.3%, a difference of 0.010%), Immigrants from Jordan (84.4%, a difference of 0.030%), and Chinese (84.3%, a difference of 0.030%).
| Demographics | Rating | Rank | In Labor Force | Age 25-29 |
| Immigrants | Armenia | 13.3 /100 | #207 | Poor 84.4% |
| Immigrants | Indonesia | 13.2 /100 | #208 | Poor 84.4% |
| Immigrants | Jordan | 12.8 /100 | #209 | Poor 84.4% |
| Chinese | 12.7 /100 | #210 | Poor 84.3% |
| Immigrants | Venezuela | 12.6 /100 | #211 | Poor 84.3% |
| Sub-Saharan Africans | 11.7 /100 | #212 | Poor 84.3% |
| Japanese | 11.4 /100 | #213 | Poor 84.3% |
| Lebanese | 11.1 /100 | #214 | Poor 84.3% |
| Immigrants | Syria | 10.7 /100 | #215 | Poor 84.3% |
| Israelis | 9.3 /100 | #216 | Tragic 84.3% |
| Immigrants | Ecuador | 9.3 /100 | #217 | Tragic 84.3% |
| Immigrants | Nigeria | 9.0 /100 | #218 | Tragic 84.3% |
| Immigrants | Saudi Arabia | 8.8 /100 | #219 | Tragic 84.3% |
| Nigerians | 7.2 /100 | #220 | Tragic 84.3% |
| Arabs | 6.8 /100 | #221 | Tragic 84.2% |