Navajo vs Laotian In Labor Force | Age 25-29
COMPARE
Navajo
Laotian
In Labor Force | Age 25-29
In Labor Force | Age 25-29 Comparison
Navajo
Laotians
74.6%
IN LABOR FORCE | AGE 25-29
0.0/ 100
METRIC RATING
345th/ 347
METRIC RANK
84.4%
IN LABOR FORCE | AGE 25-29
16.6/ 100
METRIC RATING
201st/ 347
METRIC RANK
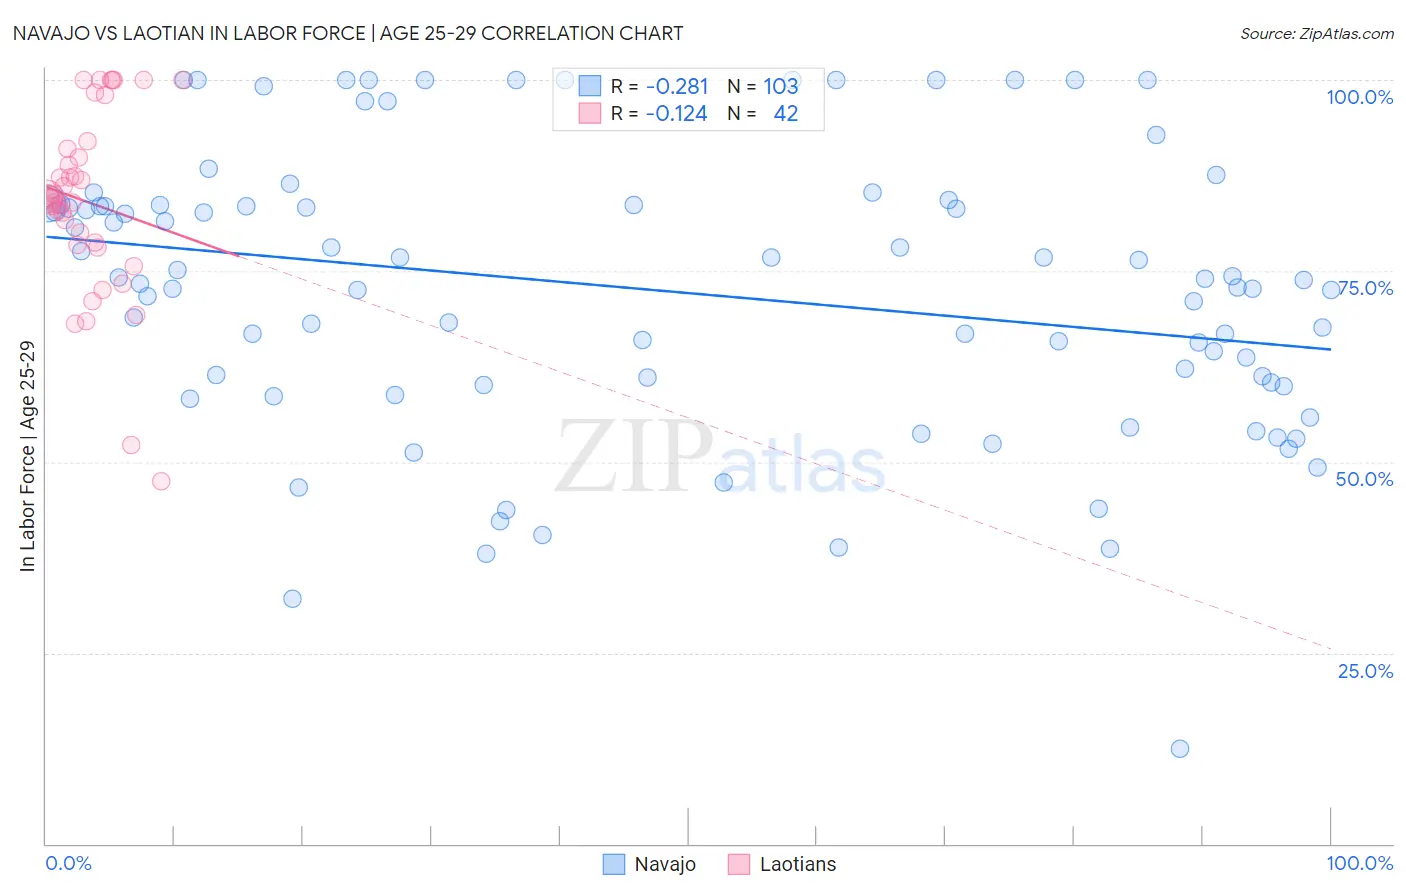
Navajo vs Laotian In Labor Force | Age 25-29 Correlation Chart
The statistical analysis conducted on geographies consisting of 224,779,280 people shows a weak negative correlation between the proportion of Navajo and labor force participation rate among population between the ages 25 and 29 in the United States with a correlation coefficient (R) of -0.281 and weighted average of 74.6%. Similarly, the statistical analysis conducted on geographies consisting of 224,828,229 people shows a poor negative correlation between the proportion of Laotians and labor force participation rate among population between the ages 25 and 29 in the United States with a correlation coefficient (R) of -0.124 and weighted average of 84.4%, a difference of 13.1%.
In Labor Force | Age 25-29 Correlation Summary
| Measurement | Navajo | Laotian |
| Minimum | 12.5% | 47.5% |
| Maximum | 100.0% | 100.0% |
| Range | 87.5% | 52.5% |
| Mean | 72.4% | 84.0% |
| Median | 73.9% | 84.6% |
| Interquartile 25% (IQ1) | 60.0% | 78.4% |
| Interquartile 75% (IQ3) | 83.7% | 91.0% |
| Interquartile Range (IQR) | 23.7% | 12.7% |
| Standard Deviation (Sample) | 18.5% | 12.2% |
| Standard Deviation (Population) | 18.4% | 12.0% |
Similar Demographics by In Labor Force | Age 25-29
Demographics Similar to Navajo by In Labor Force | Age 25-29
In terms of in labor force | age 25-29, the demographic groups most similar to Navajo are Pima (74.3%, a difference of 0.48%), Yup'ik (73.1%, a difference of 2.2%), Hopi (76.5%, a difference of 2.5%), Arapaho (76.6%, a difference of 2.6%), and Pueblo (77.5%, a difference of 3.8%).
| Demographics | Rating | Rank | In Labor Force | Age 25-29 |
| Sioux | 0.0 /100 | #333 | Tragic 79.7% |
| Yuman | 0.0 /100 | #334 | Tragic 79.3% |
| Natives/Alaskans | 0.0 /100 | #335 | Tragic 79.3% |
| Apache | 0.0 /100 | #336 | Tragic 79.2% |
| Crow | 0.0 /100 | #337 | Tragic 78.6% |
| Lumbee | 0.0 /100 | #338 | Tragic 78.3% |
| Immigrants | Yemen | 0.0 /100 | #339 | Tragic 78.2% |
| Paiute | 0.0 /100 | #340 | Tragic 78.1% |
| Tohono O'odham | 0.0 /100 | #341 | Tragic 77.5% |
| Pueblo | 0.0 /100 | #342 | Tragic 77.5% |
| Arapaho | 0.0 /100 | #343 | Tragic 76.6% |
| Hopi | 0.0 /100 | #344 | Tragic 76.5% |
| Navajo | 0.0 /100 | #345 | Tragic 74.6% |
| Pima | 0.0 /100 | #346 | Tragic 74.3% |
| Yup'ik | 0.0 /100 | #347 | Tragic 73.1% |
Demographics Similar to Laotians by In Labor Force | Age 25-29
In terms of in labor force | age 25-29, the demographic groups most similar to Laotians are Immigrants from Kazakhstan (84.4%, a difference of 0.010%), Afghan (84.4%, a difference of 0.010%), Immigrants from Afghanistan (84.4%, a difference of 0.010%), Immigrants from Germany (84.4%, a difference of 0.020%), and Venezuelan (84.4%, a difference of 0.020%).
| Demographics | Rating | Rank | In Labor Force | Age 25-29 |
| Portuguese | 21.2 /100 | #194 | Fair 84.4% |
| Immigrants | Israel | 20.8 /100 | #195 | Fair 84.4% |
| Immigrants | South Eastern Asia | 19.5 /100 | #196 | Poor 84.4% |
| Tlingit-Haida | 19.3 /100 | #197 | Poor 84.4% |
| Immigrants | Iraq | 19.0 /100 | #198 | Poor 84.4% |
| Immigrants | Germany | 18.3 /100 | #199 | Poor 84.4% |
| Immigrants | Kazakhstan | 17.5 /100 | #200 | Poor 84.4% |
| Laotians | 16.6 /100 | #201 | Poor 84.4% |
| Afghans | 15.9 /100 | #202 | Poor 84.4% |
| Immigrants | Afghanistan | 15.6 /100 | #203 | Poor 84.4% |
| Venezuelans | 15.1 /100 | #204 | Poor 84.4% |
| Ecuadorians | 14.8 /100 | #205 | Poor 84.4% |
| Immigrants | Cambodia | 14.3 /100 | #206 | Poor 84.4% |
| Immigrants | Armenia | 13.3 /100 | #207 | Poor 84.4% |
| Immigrants | Indonesia | 13.2 /100 | #208 | Poor 84.4% |