Navajo vs Lebanese Unemployment Among Ages 55 to 59 years
COMPARE
Navajo
Lebanese
Unemployment Among Ages 55 to 59 years
Unemployment Among Ages 55 to 59 years Comparison
Navajo
Lebanese
6.7%
UNEMPLOYMENT AMONG AGES 55 TO 59 YEARS
0.0/ 100
METRIC RATING
336th/ 347
METRIC RANK
4.6%
UNEMPLOYMENT AMONG AGES 55 TO 59 YEARS
97.5/ 100
METRIC RATING
83rd/ 347
METRIC RANK
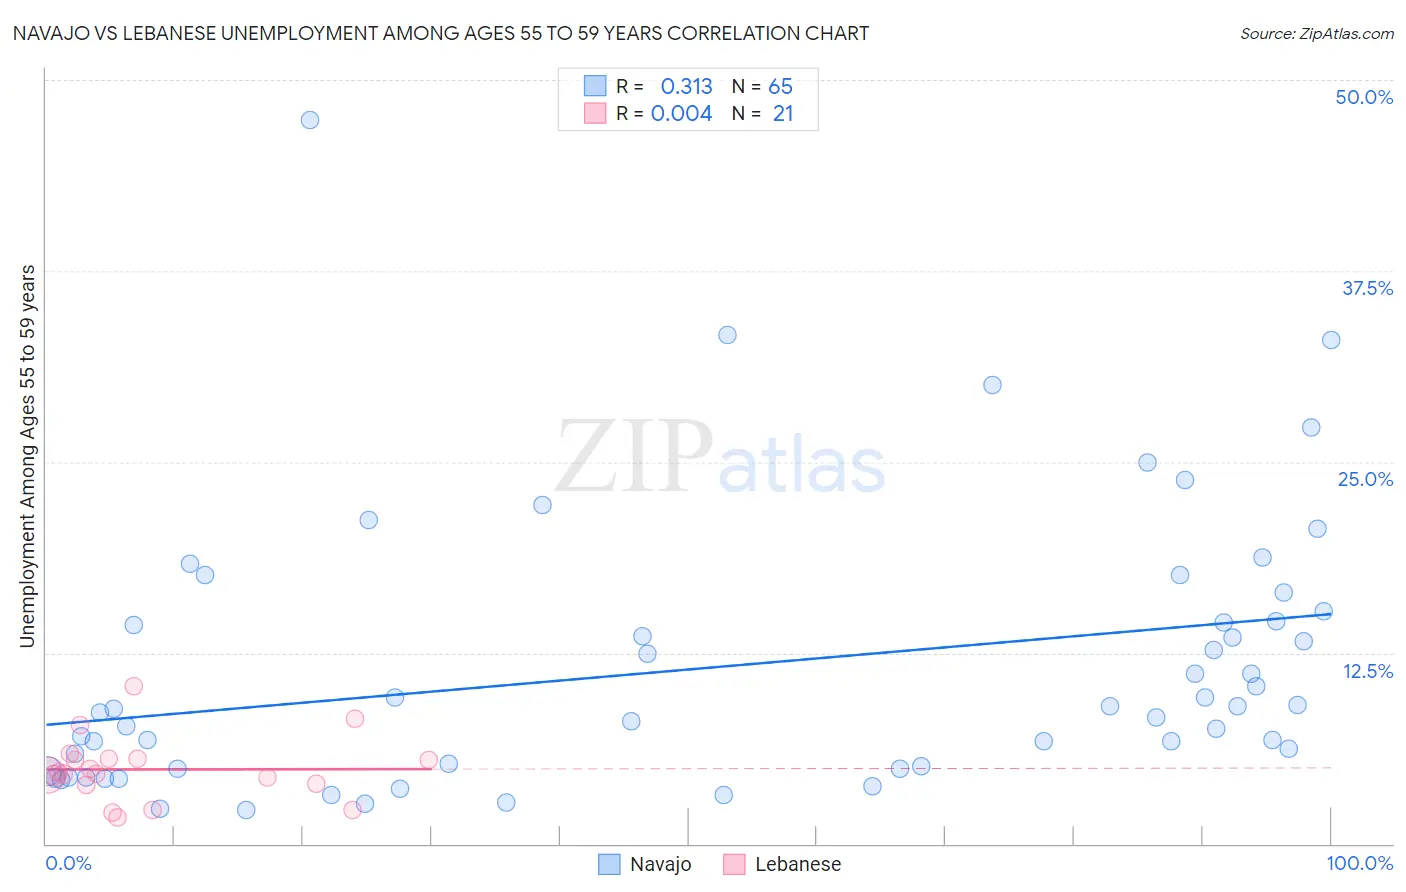
Navajo vs Lebanese Unemployment Among Ages 55 to 59 years Correlation Chart
The statistical analysis conducted on geographies consisting of 212,930,605 people shows a mild positive correlation between the proportion of Navajo and unemployment rate among population between the ages 55 and 59 in the United States with a correlation coefficient (R) of 0.313 and weighted average of 6.7%. Similarly, the statistical analysis conducted on geographies consisting of 373,432,336 people shows no correlation between the proportion of Lebanese and unemployment rate among population between the ages 55 and 59 in the United States with a correlation coefficient (R) of 0.004 and weighted average of 4.6%, a difference of 44.9%.
Unemployment Among Ages 55 to 59 years Correlation Summary
| Measurement | Navajo | Lebanese |
| Minimum | 2.2% | 1.7% |
| Maximum | 47.4% | 10.3% |
| Range | 45.2% | 8.6% |
| Mean | 11.6% | 4.9% |
| Median | 8.8% | 4.6% |
| Interquartile 25% (IQ1) | 4.9% | 3.9% |
| Interquartile 75% (IQ3) | 14.9% | 5.6% |
| Interquartile Range (IQR) | 10.0% | 1.7% |
| Standard Deviation (Sample) | 8.9% | 2.1% |
| Standard Deviation (Population) | 8.9% | 2.0% |
Similar Demographics by Unemployment Among Ages 55 to 59 years
Demographics Similar to Navajo by Unemployment Among Ages 55 to 59 years
In terms of unemployment among ages 55 to 59 years, the demographic groups most similar to Navajo are Colville (6.7%, a difference of 0.15%), Pueblo (6.7%, a difference of 0.33%), Paiute (6.8%, a difference of 0.52%), Pima (6.6%, a difference of 1.6%), and Immigrants from Yemen (6.9%, a difference of 2.5%).
| Demographics | Rating | Rank | Unemployment Among Ages 55 to 59 years |
| Dominicans | 0.0 /100 | #329 | Tragic 6.2% |
| Alaska Natives | 0.0 /100 | #330 | Tragic 6.2% |
| Immigrants | Dominican Republic | 0.0 /100 | #331 | Tragic 6.3% |
| Aleuts | 0.0 /100 | #332 | Tragic 6.4% |
| Pima | 0.0 /100 | #333 | Tragic 6.6% |
| Pueblo | 0.0 /100 | #334 | Tragic 6.7% |
| Colville | 0.0 /100 | #335 | Tragic 6.7% |
| Navajo | 0.0 /100 | #336 | Tragic 6.7% |
| Paiute | 0.0 /100 | #337 | Tragic 6.8% |
| Immigrants | Yemen | 0.0 /100 | #338 | Tragic 6.9% |
| Puerto Ricans | 0.0 /100 | #339 | Tragic 7.0% |
| Alaskan Athabascans | 0.0 /100 | #340 | Tragic 7.1% |
| Shoshone | 0.0 /100 | #341 | Tragic 7.4% |
| Hopi | 0.0 /100 | #342 | Tragic 8.1% |
| Yakama | 0.0 /100 | #343 | Tragic 8.9% |
Demographics Similar to Lebanese by Unemployment Among Ages 55 to 59 years
In terms of unemployment among ages 55 to 59 years, the demographic groups most similar to Lebanese are Latvian (4.6%, a difference of 0.12%), Taiwanese (4.6%, a difference of 0.17%), Cambodian (4.6%, a difference of 0.24%), Malaysian (4.7%, a difference of 0.24%), and Immigrants from Vietnam (4.7%, a difference of 0.24%).
| Demographics | Rating | Rank | Unemployment Among Ages 55 to 59 years |
| Immigrants | Bosnia and Herzegovina | 98.3 /100 | #76 | Exceptional 4.6% |
| Scotch-Irish | 98.3 /100 | #77 | Exceptional 4.6% |
| Finns | 98.2 /100 | #78 | Exceptional 4.6% |
| Sri Lankans | 98.1 /100 | #79 | Exceptional 4.6% |
| Cambodians | 98.0 /100 | #80 | Exceptional 4.6% |
| Taiwanese | 97.9 /100 | #81 | Exceptional 4.6% |
| Latvians | 97.8 /100 | #82 | Exceptional 4.6% |
| Lebanese | 97.5 /100 | #83 | Exceptional 4.6% |
| Malaysians | 96.9 /100 | #84 | Exceptional 4.7% |
| Immigrants | Vietnam | 96.9 /100 | #85 | Exceptional 4.7% |
| Immigrants | Colombia | 96.9 /100 | #86 | Exceptional 4.7% |
| Poles | 96.9 /100 | #87 | Exceptional 4.7% |
| Immigrants | Cameroon | 96.9 /100 | #88 | Exceptional 4.7% |
| Irish | 96.8 /100 | #89 | Exceptional 4.7% |
| Immigrants | Poland | 96.4 /100 | #90 | Exceptional 4.7% |