British West Indian vs Lebanese In Labor Force | Age 25-29
COMPARE
British West Indian
Lebanese
In Labor Force | Age 25-29
In Labor Force | Age 25-29 Comparison
British West Indians
Lebanese
83.2%
IN LABOR FORCE | AGE 25-29
0.0/ 100
METRIC RATING
279th/ 347
METRIC RANK
84.3%
IN LABOR FORCE | AGE 25-29
11.1/ 100
METRIC RATING
214th/ 347
METRIC RANK
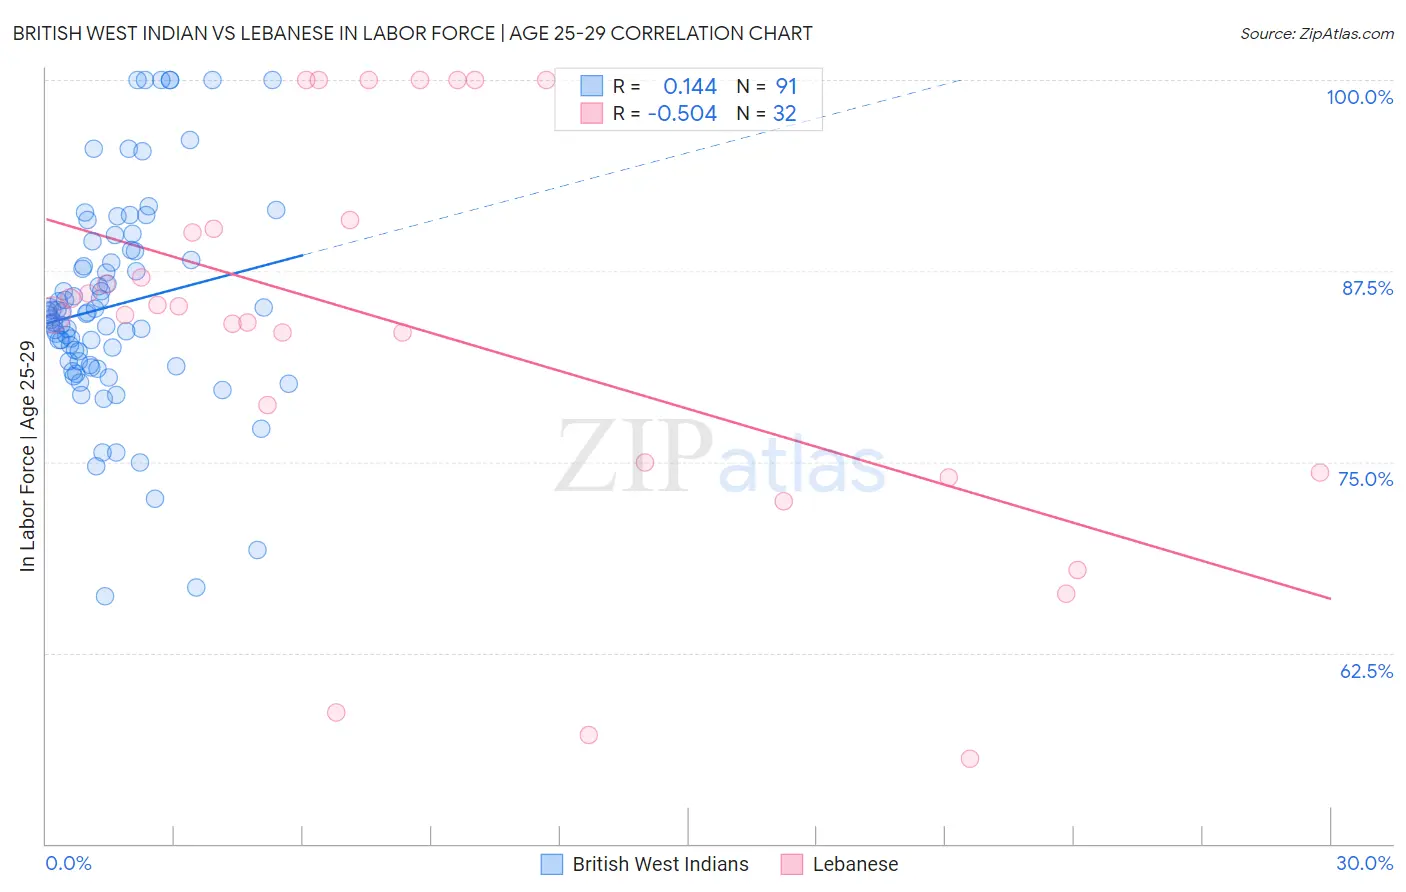
British West Indian vs Lebanese In Labor Force | Age 25-29 Correlation Chart
The statistical analysis conducted on geographies consisting of 152,666,042 people shows a poor positive correlation between the proportion of British West Indians and labor force participation rate among population between the ages 25 and 29 in the United States with a correlation coefficient (R) of 0.144 and weighted average of 83.2%. Similarly, the statistical analysis conducted on geographies consisting of 401,455,455 people shows a substantial negative correlation between the proportion of Lebanese and labor force participation rate among population between the ages 25 and 29 in the United States with a correlation coefficient (R) of -0.504 and weighted average of 84.3%, a difference of 1.4%.
In Labor Force | Age 25-29 Correlation Summary
| Measurement | British West Indian | Lebanese |
| Minimum | 66.2% | 55.6% |
| Maximum | 100.0% | 100.0% |
| Range | 33.8% | 44.4% |
| Mean | 85.2% | 83.5% |
| Median | 84.7% | 84.9% |
| Interquartile 25% (IQ1) | 81.3% | 74.7% |
| Interquartile 75% (IQ3) | 88.8% | 90.5% |
| Interquartile Range (IQR) | 7.5% | 15.9% |
| Standard Deviation (Sample) | 7.0% | 12.8% |
| Standard Deviation (Population) | 6.9% | 12.6% |
Similar Demographics by In Labor Force | Age 25-29
Demographics Similar to British West Indians by In Labor Force | Age 25-29
In terms of in labor force | age 25-29, the demographic groups most similar to British West Indians are Immigrants from Cuba (83.2%, a difference of 0.010%), Dominican (83.2%, a difference of 0.020%), African (83.2%, a difference of 0.060%), Immigrants from Dominican Republic (83.1%, a difference of 0.080%), and American (83.1%, a difference of 0.090%).
| Demographics | Rating | Rank | In Labor Force | Age 25-29 |
| Immigrants | Caribbean | 0.0 /100 | #272 | Tragic 83.4% |
| Immigrants | Dominica | 0.0 /100 | #273 | Tragic 83.4% |
| Marshallese | 0.0 /100 | #274 | Tragic 83.3% |
| Samoans | 0.0 /100 | #275 | Tragic 83.3% |
| Immigrants | Honduras | 0.0 /100 | #276 | Tragic 83.3% |
| Africans | 0.0 /100 | #277 | Tragic 83.2% |
| Immigrants | Cuba | 0.0 /100 | #278 | Tragic 83.2% |
| British West Indians | 0.0 /100 | #279 | Tragic 83.2% |
| Dominicans | 0.0 /100 | #280 | Tragic 83.2% |
| Immigrants | Dominican Republic | 0.0 /100 | #281 | Tragic 83.1% |
| Americans | 0.0 /100 | #282 | Tragic 83.1% |
| Immigrants | Azores | 0.0 /100 | #283 | Tragic 83.1% |
| Nicaraguans | 0.0 /100 | #284 | Tragic 83.1% |
| Belizeans | 0.0 /100 | #285 | Tragic 83.1% |
| Mexican American Indians | 0.0 /100 | #286 | Tragic 83.0% |
Demographics Similar to Lebanese by In Labor Force | Age 25-29
In terms of in labor force | age 25-29, the demographic groups most similar to Lebanese are Subsaharan African (84.3%, a difference of 0.010%), Japanese (84.3%, a difference of 0.010%), Immigrants from Syria (84.3%, a difference of 0.010%), Immigrants from Jordan (84.4%, a difference of 0.030%), and Chinese (84.3%, a difference of 0.030%).
| Demographics | Rating | Rank | In Labor Force | Age 25-29 |
| Immigrants | Armenia | 13.3 /100 | #207 | Poor 84.4% |
| Immigrants | Indonesia | 13.2 /100 | #208 | Poor 84.4% |
| Immigrants | Jordan | 12.8 /100 | #209 | Poor 84.4% |
| Chinese | 12.7 /100 | #210 | Poor 84.3% |
| Immigrants | Venezuela | 12.6 /100 | #211 | Poor 84.3% |
| Sub-Saharan Africans | 11.7 /100 | #212 | Poor 84.3% |
| Japanese | 11.4 /100 | #213 | Poor 84.3% |
| Lebanese | 11.1 /100 | #214 | Poor 84.3% |
| Immigrants | Syria | 10.7 /100 | #215 | Poor 84.3% |
| Israelis | 9.3 /100 | #216 | Tragic 84.3% |
| Immigrants | Ecuador | 9.3 /100 | #217 | Tragic 84.3% |
| Immigrants | Nigeria | 9.0 /100 | #218 | Tragic 84.3% |
| Immigrants | Saudi Arabia | 8.8 /100 | #219 | Tragic 84.3% |
| Nigerians | 7.2 /100 | #220 | Tragic 84.3% |
| Arabs | 6.8 /100 | #221 | Tragic 84.2% |