Immigrants from Guyana vs Lebanese In Labor Force | Age 25-29
COMPARE
Immigrants from Guyana
Lebanese
In Labor Force | Age 25-29
In Labor Force | Age 25-29 Comparison
Immigrants from Guyana
Lebanese
83.0%
IN LABOR FORCE | AGE 25-29
0.0/ 100
METRIC RATING
292nd/ 347
METRIC RANK
84.3%
IN LABOR FORCE | AGE 25-29
11.1/ 100
METRIC RATING
214th/ 347
METRIC RANK
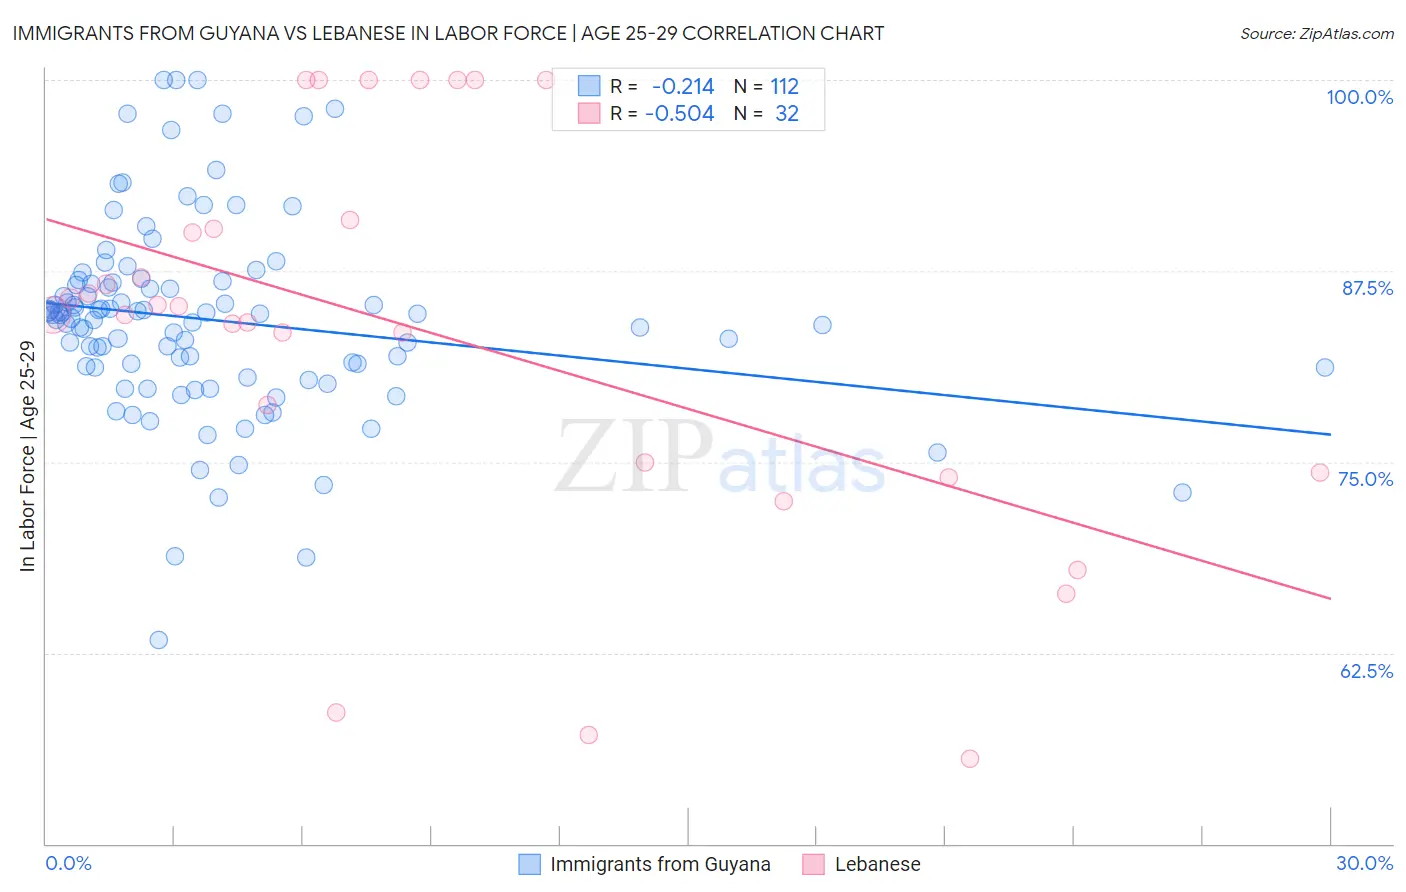
Immigrants from Guyana vs Lebanese In Labor Force | Age 25-29 Correlation Chart
The statistical analysis conducted on geographies consisting of 183,703,762 people shows a weak negative correlation between the proportion of Immigrants from Guyana and labor force participation rate among population between the ages 25 and 29 in the United States with a correlation coefficient (R) of -0.214 and weighted average of 83.0%. Similarly, the statistical analysis conducted on geographies consisting of 401,455,455 people shows a substantial negative correlation between the proportion of Lebanese and labor force participation rate among population between the ages 25 and 29 in the United States with a correlation coefficient (R) of -0.504 and weighted average of 84.3%, a difference of 1.7%.
In Labor Force | Age 25-29 Correlation Summary
| Measurement | Immigrants from Guyana | Lebanese |
| Minimum | 63.4% | 55.6% |
| Maximum | 100.0% | 100.0% |
| Range | 36.6% | 44.4% |
| Mean | 84.3% | 83.5% |
| Median | 84.6% | 84.9% |
| Interquartile 25% (IQ1) | 81.2% | 74.7% |
| Interquartile 75% (IQ3) | 86.7% | 90.5% |
| Interquartile Range (IQR) | 5.5% | 15.9% |
| Standard Deviation (Sample) | 6.4% | 12.8% |
| Standard Deviation (Population) | 6.4% | 12.6% |
Similar Demographics by In Labor Force | Age 25-29
Demographics Similar to Immigrants from Guyana by In Labor Force | Age 25-29
In terms of in labor force | age 25-29, the demographic groups most similar to Immigrants from Guyana are Immigrants from Bangladesh (83.0%, a difference of 0.020%), Hawaiian (83.0%, a difference of 0.020%), Immigrants from Latin America (82.9%, a difference of 0.030%), Nepalese (82.9%, a difference of 0.040%), and Chippewa (82.9%, a difference of 0.040%).
| Demographics | Rating | Rank | In Labor Force | Age 25-29 |
| Belizeans | 0.0 /100 | #285 | Tragic 83.1% |
| Mexican American Indians | 0.0 /100 | #286 | Tragic 83.0% |
| Guyanese | 0.0 /100 | #287 | Tragic 83.0% |
| Ottawa | 0.0 /100 | #288 | Tragic 83.0% |
| Immigrants | Micronesia | 0.0 /100 | #289 | Tragic 83.0% |
| Immigrants | Bangladesh | 0.0 /100 | #290 | Tragic 83.0% |
| Hawaiians | 0.0 /100 | #291 | Tragic 83.0% |
| Immigrants | Guyana | 0.0 /100 | #292 | Tragic 83.0% |
| Immigrants | Latin America | 0.0 /100 | #293 | Tragic 82.9% |
| Nepalese | 0.0 /100 | #294 | Tragic 82.9% |
| Chippewa | 0.0 /100 | #295 | Tragic 82.9% |
| Immigrants | Nicaragua | 0.0 /100 | #296 | Tragic 82.9% |
| Potawatomi | 0.0 /100 | #297 | Tragic 82.9% |
| Native Hawaiians | 0.0 /100 | #298 | Tragic 82.9% |
| Fijians | 0.0 /100 | #299 | Tragic 82.9% |
Demographics Similar to Lebanese by In Labor Force | Age 25-29
In terms of in labor force | age 25-29, the demographic groups most similar to Lebanese are Subsaharan African (84.3%, a difference of 0.010%), Japanese (84.3%, a difference of 0.010%), Immigrants from Syria (84.3%, a difference of 0.010%), Immigrants from Jordan (84.4%, a difference of 0.030%), and Chinese (84.3%, a difference of 0.030%).
| Demographics | Rating | Rank | In Labor Force | Age 25-29 |
| Immigrants | Armenia | 13.3 /100 | #207 | Poor 84.4% |
| Immigrants | Indonesia | 13.2 /100 | #208 | Poor 84.4% |
| Immigrants | Jordan | 12.8 /100 | #209 | Poor 84.4% |
| Chinese | 12.7 /100 | #210 | Poor 84.3% |
| Immigrants | Venezuela | 12.6 /100 | #211 | Poor 84.3% |
| Sub-Saharan Africans | 11.7 /100 | #212 | Poor 84.3% |
| Japanese | 11.4 /100 | #213 | Poor 84.3% |
| Lebanese | 11.1 /100 | #214 | Poor 84.3% |
| Immigrants | Syria | 10.7 /100 | #215 | Poor 84.3% |
| Israelis | 9.3 /100 | #216 | Tragic 84.3% |
| Immigrants | Ecuador | 9.3 /100 | #217 | Tragic 84.3% |
| Immigrants | Nigeria | 9.0 /100 | #218 | Tragic 84.3% |
| Immigrants | Saudi Arabia | 8.8 /100 | #219 | Tragic 84.3% |
| Nigerians | 7.2 /100 | #220 | Tragic 84.3% |
| Arabs | 6.8 /100 | #221 | Tragic 84.2% |