Navajo vs Immigrants from Egypt In Labor Force | Age 25-29
COMPARE
Navajo
Immigrants from Egypt
In Labor Force | Age 25-29
In Labor Force | Age 25-29 Comparison
Navajo
Immigrants from Egypt
74.6%
IN LABOR FORCE | AGE 25-29
0.0/ 100
METRIC RATING
345th/ 347
METRIC RANK
85.2%
IN LABOR FORCE | AGE 25-29
97.7/ 100
METRIC RATING
78th/ 347
METRIC RANK
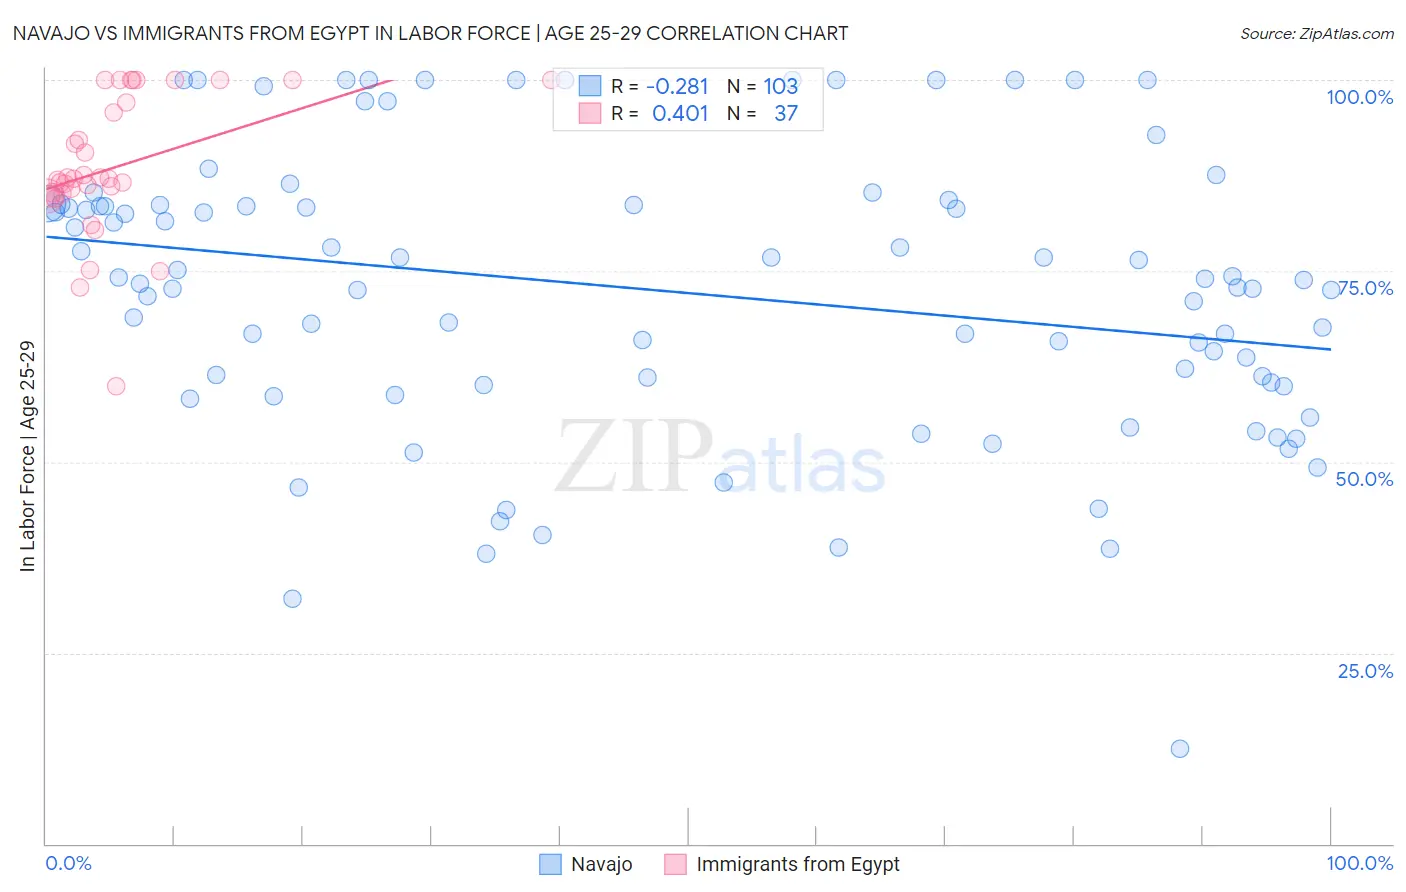
Navajo vs Immigrants from Egypt In Labor Force | Age 25-29 Correlation Chart
The statistical analysis conducted on geographies consisting of 224,779,280 people shows a weak negative correlation between the proportion of Navajo and labor force participation rate among population between the ages 25 and 29 in the United States with a correlation coefficient (R) of -0.281 and weighted average of 74.6%. Similarly, the statistical analysis conducted on geographies consisting of 245,441,194 people shows a moderate positive correlation between the proportion of Immigrants from Egypt and labor force participation rate among population between the ages 25 and 29 in the United States with a correlation coefficient (R) of 0.401 and weighted average of 85.2%, a difference of 14.2%.
In Labor Force | Age 25-29 Correlation Summary
| Measurement | Navajo | Immigrants from Egypt |
| Minimum | 12.5% | 59.9% |
| Maximum | 100.0% | 100.0% |
| Range | 87.5% | 40.1% |
| Mean | 72.4% | 88.6% |
| Median | 73.9% | 87.1% |
| Interquartile 25% (IQ1) | 60.0% | 85.0% |
| Interquartile 75% (IQ3) | 83.7% | 98.6% |
| Interquartile Range (IQR) | 23.7% | 13.6% |
| Standard Deviation (Sample) | 18.5% | 9.1% |
| Standard Deviation (Population) | 18.4% | 9.0% |
Similar Demographics by In Labor Force | Age 25-29
Demographics Similar to Navajo by In Labor Force | Age 25-29
In terms of in labor force | age 25-29, the demographic groups most similar to Navajo are Pima (74.3%, a difference of 0.48%), Yup'ik (73.1%, a difference of 2.2%), Hopi (76.5%, a difference of 2.5%), Arapaho (76.6%, a difference of 2.6%), and Pueblo (77.5%, a difference of 3.8%).
| Demographics | Rating | Rank | In Labor Force | Age 25-29 |
| Sioux | 0.0 /100 | #333 | Tragic 79.7% |
| Yuman | 0.0 /100 | #334 | Tragic 79.3% |
| Natives/Alaskans | 0.0 /100 | #335 | Tragic 79.3% |
| Apache | 0.0 /100 | #336 | Tragic 79.2% |
| Crow | 0.0 /100 | #337 | Tragic 78.6% |
| Lumbee | 0.0 /100 | #338 | Tragic 78.3% |
| Immigrants | Yemen | 0.0 /100 | #339 | Tragic 78.2% |
| Paiute | 0.0 /100 | #340 | Tragic 78.1% |
| Tohono O'odham | 0.0 /100 | #341 | Tragic 77.5% |
| Pueblo | 0.0 /100 | #342 | Tragic 77.5% |
| Arapaho | 0.0 /100 | #343 | Tragic 76.6% |
| Hopi | 0.0 /100 | #344 | Tragic 76.5% |
| Navajo | 0.0 /100 | #345 | Tragic 74.6% |
| Pima | 0.0 /100 | #346 | Tragic 74.3% |
| Yup'ik | 0.0 /100 | #347 | Tragic 73.1% |
Demographics Similar to Immigrants from Egypt by In Labor Force | Age 25-29
In terms of in labor force | age 25-29, the demographic groups most similar to Immigrants from Egypt are Immigrants from Northern Africa (85.2%, a difference of 0.010%), Immigrants from Zimbabwe (85.2%, a difference of 0.010%), Immigrants from South Central Asia (85.2%, a difference of 0.020%), German (85.3%, a difference of 0.030%), and Immigrants from Northern Europe (85.2%, a difference of 0.030%).
| Demographics | Rating | Rank | In Labor Force | Age 25-29 |
| Kenyans | 99.0 /100 | #71 | Exceptional 85.4% |
| Immigrants | Australia | 98.9 /100 | #72 | Exceptional 85.3% |
| Russians | 98.8 /100 | #73 | Exceptional 85.3% |
| Soviet Union | 98.5 /100 | #74 | Exceptional 85.3% |
| Brazilians | 98.3 /100 | #75 | Exceptional 85.3% |
| Germans | 98.1 /100 | #76 | Exceptional 85.3% |
| Immigrants | South Central Asia | 97.9 /100 | #77 | Exceptional 85.2% |
| Immigrants | Egypt | 97.7 /100 | #78 | Exceptional 85.2% |
| Immigrants | Northern Africa | 97.6 /100 | #79 | Exceptional 85.2% |
| Immigrants | Zimbabwe | 97.6 /100 | #80 | Exceptional 85.2% |
| Immigrants | Northern Europe | 97.2 /100 | #81 | Exceptional 85.2% |
| Okinawans | 97.0 /100 | #82 | Exceptional 85.2% |
| Immigrants | Europe | 96.8 /100 | #83 | Exceptional 85.2% |
| Immigrants | Eastern Europe | 96.8 /100 | #84 | Exceptional 85.2% |
| Immigrants | Africa | 96.7 /100 | #85 | Exceptional 85.2% |