Immigrants from Greece vs Immigrants from Burma/Myanmar In Labor Force | Age 30-34

COMPARE

Immigrants from Greece
Race
Ancestry
AfghanAfricanAlaska NativeAlaskan AthabascanAlbanianAleutAlsatianAmericanApacheArabArapahoArgentineanArmenianAssyrian/Chaldean/SyriacAustralianAustrianBahamianBangladeshiBarbadianBasqueBelgianBelizeanBermudanBhutaneseBlackfeetBolivianBrazilianBritishBritish West IndianBulgarianBurmeseCajunCambodianCanadianCape VerdeanCarpatho RusynCelticCentral AmericanCentral American IndianCherokeeCheyenneChickasawChileanChineseChippewaChoctawColombianColvilleComancheCosta RicanCreeCreekCroatianCrowCubanCypriotCzechCzechoslovakianDanishDelawareDominicanDutchDutch West IndianEastern EuropeanEcuadorianEgyptianEnglishEstonianEthiopianEuropeanFijianFilipinoFinnishFrenchFrench American IndianFrench CanadianGermanGerman RussianGhanaianGreekGuamanian/ChamorroGuatemalanGuyaneseHaitianHmongHonduranHopiHoumaHungarianIcelanderIndian (Asian)IndonesianInupiatIranianIraqiIrishIroquoisIsraeliItalianJamaicanJapaneseJordanianKenyanKiowaKoreanLaotianLatvianLebaneseLiberianLithuanianLumbeeLuxembourgerMacedonianMalaysianMalteseMarshalleseMenomineeMexicanMexican American IndianMongolianMoroccanNative HawaiianNavajoNepaleseNew ZealanderNicaraguanNigerianNorthern EuropeanNorwegianOkinawanOsageOttawaPaiutePakistaniPalestinianPanamanianParaguayanPennsylvania GermanPeruvianPimaPolishPortuguesePotawatomiPuebloPuerto RicanPuget Sound SalishRomanianRussianSalvadoranSamoanScandinavianScotch-IrishScottishSeminoleSenegaleseSerbianShoshoneSierra LeoneanSiouxSlavicSlovakSloveneSomaliSouth AfricanSouth AmericanSouth American IndianSoviet UnionSpaniardSpanishSpanish AmericanSpanish American IndianSri LankanSubsaharan AfricanSudaneseSwedishSwissSyrianTaiwaneseThaiTlingit-HaidaTohono O'OdhamTonganTrinidadian and TobagonianTsimshianTurkishU.S. Virgin IslanderUgandanUkrainianUruguayanUteVenezuelanVietnameseWelshWest IndianYakamaYaquiYugoslavianYumanYup'ikZimbabwean
Immigration
NonimmigrantsImmigrantsAfghanistanAfricaAlbaniaArgentinaArmeniaAsiaAustraliaAustriaBahamasBangladeshBarbadosBelarusBelgiumBelizeBoliviaBosnia and HerzegovinaBrazilBulgariaCabo VerdeCambodiaCameroonCanadaCaribbeanCentral AmericaChileChinaColombiaCongoCosta RicaCroatiaCubaCzechoslovakiaDenmarkDominicaDominican RepublicEastern AfricaEastern AsiaEastern EuropeEcuadorEgyptEl SalvadorEnglandEritreaEthiopiaEuropeFijiFranceGermanyGhanaGreeceGrenadaGuatemalaGuyanaHaitiHondurasHong KongHungaryIndiaIndonesiaIranIraqIrelandIsraelItalyJamaicaJapanJordanKazakhstanKenyaKoreaKuwaitLaosLatin AmericaLatviaLebanonLiberiaLithuaniaMalaysiaMexicoMicronesiaMiddle AfricaMoldovaMoroccoNepalNetherlandsNicaraguaNigeriaNorth AmericaNorth MacedoniaNorthern AfricaNorthern EuropeNorwayOceaniaPakistanPanamaPeruPhilippinesPolandPortugalRomaniaRussiaSaudi ArabiaScotlandSenegalSerbiaSierra LeoneSingaporeSomaliaSouth AfricaSouth AmericaSouth Central AsiaSouth Eastern AsiaSouthern EuropeSpainSri LankaSt. Vincent and the GrenadinesSudanSwedenSwitzerlandSyriaTaiwanThailandTrinidad and TobagoTurkeyUgandaUkraineUruguayUzbekistanVenezuelaVietnamWest IndiesWestern AfricaWestern AsiaWestern EuropeYemenZaireZimbabweAzores
Immigrants from Burma/Myanmar
Race
Ancestry
AfghanAfricanAlaska NativeAlaskan AthabascanAlbanianAleutAlsatianAmericanApacheArabArapahoArgentineanArmenianAssyrian/Chaldean/SyriacAustralianAustrianBahamianBangladeshiBarbadianBasqueBelgianBelizeanBermudanBhutaneseBlackfeetBolivianBrazilianBritishBritish West IndianBulgarianBurmeseCajunCambodianCanadianCape VerdeanCarpatho RusynCelticCentral AmericanCentral American IndianCherokeeCheyenneChickasawChileanChineseChippewaChoctawColombianColvilleComancheCosta RicanCreeCreekCroatianCrowCubanCypriotCzechCzechoslovakianDanishDelawareDominicanDutchDutch West IndianEastern EuropeanEcuadorianEgyptianEnglishEstonianEthiopianEuropeanFijianFilipinoFinnishFrenchFrench American IndianFrench CanadianGermanGerman RussianGhanaianGreekGuamanian/ChamorroGuatemalanGuyaneseHaitianHmongHonduranHopiHoumaHungarianIcelanderIndian (Asian)IndonesianInupiatIranianIraqiIrishIroquoisIsraeliItalianJamaicanJapaneseJordanianKenyanKiowaKoreanLaotianLatvianLebaneseLiberianLithuanianLumbeeLuxembourgerMacedonianMalaysianMalteseMarshalleseMenomineeMexicanMexican American IndianMongolianMoroccanNative HawaiianNavajoNepaleseNew ZealanderNicaraguanNigerianNorthern EuropeanNorwegianOkinawanOsageOttawaPaiutePakistaniPalestinianPanamanianParaguayanPennsylvania GermanPeruvianPimaPolishPortuguesePotawatomiPuebloPuerto RicanPuget Sound SalishRomanianRussianSalvadoranSamoanScandinavianScotch-IrishScottishSeminoleSenegaleseSerbianShoshoneSierra LeoneanSiouxSlavicSlovakSloveneSomaliSouth AfricanSouth AmericanSouth American IndianSoviet UnionSpaniardSpanishSpanish AmericanSpanish American IndianSri LankanSubsaharan AfricanSudaneseSwedishSwissSyrianTaiwaneseThaiTlingit-HaidaTohono O'OdhamTonganTrinidadian and TobagonianTsimshianTurkishU.S. Virgin IslanderUgandanUkrainianUruguayanUteVenezuelanVietnameseWelshWest IndianYakamaYaquiYugoslavianYumanYup'ikZimbabwean
Immigration
NonimmigrantsImmigrantsAfghanistanAfricaAlbaniaArgentinaArmeniaAsiaAustraliaAustriaBahamasBangladeshBarbadosBelarusBelgiumBelizeBoliviaBosnia and HerzegovinaBrazilBulgariaBurma/MyanmarCabo VerdeCambodiaCameroonCanadaCaribbeanCentral AmericaChileChinaColombiaCongoCosta RicaCroatiaCubaCzechoslovakiaDenmarkDominicaDominican RepublicEastern AfricaEastern AsiaEastern EuropeEcuadorEgyptEl SalvadorEnglandEritreaEthiopiaEuropeFijiFranceGermanyGhanaGrenadaGuatemalaGuyanaHaitiHondurasHong KongHungaryIndiaIndonesiaIranIraqIrelandIsraelItalyJamaicaJapanJordanKazakhstanKenyaKoreaKuwaitLaosLatin AmericaLatviaLebanonLiberiaLithuaniaMalaysiaMexicoMicronesiaMiddle AfricaMoldovaMoroccoNepalNetherlandsNicaraguaNigeriaNorth AmericaNorth MacedoniaNorthern AfricaNorthern EuropeNorwayOceaniaPakistanPanamaPeruPhilippinesPolandPortugalRomaniaRussiaSaudi ArabiaScotlandSenegalSerbiaSierra LeoneSingaporeSomaliaSouth AfricaSouth AmericaSouth Central AsiaSouth Eastern AsiaSouthern EuropeSpainSri LankaSt. Vincent and the GrenadinesSudanSwedenSwitzerlandSyriaTaiwanThailandTrinidad and TobagoTurkeyUgandaUkraineUruguayUzbekistanVenezuelaVietnamWest IndiesWestern AfricaWestern AsiaWestern EuropeYemenZaireZimbabweAzores
In Labor Force | Age 30-34
Income
Poverty
Unemployment
Labor Participation
Family Structure
Vehicle Availability
Education Level
Disability

In Labor Force | Age 30-34 Comparison

Immigrants from Greece

Immigrants from Burma/Myanmar

Exceptional
Average
85.7%
IN LABOR FORCE | AGE 30-34
99.9/ 100
METRIC RATING
38th/ 347
METRIC RANK
84.7%
IN LABOR FORCE | AGE 30-34
52.0/ 100
METRIC RATING
170th/ 347
METRIC RANK

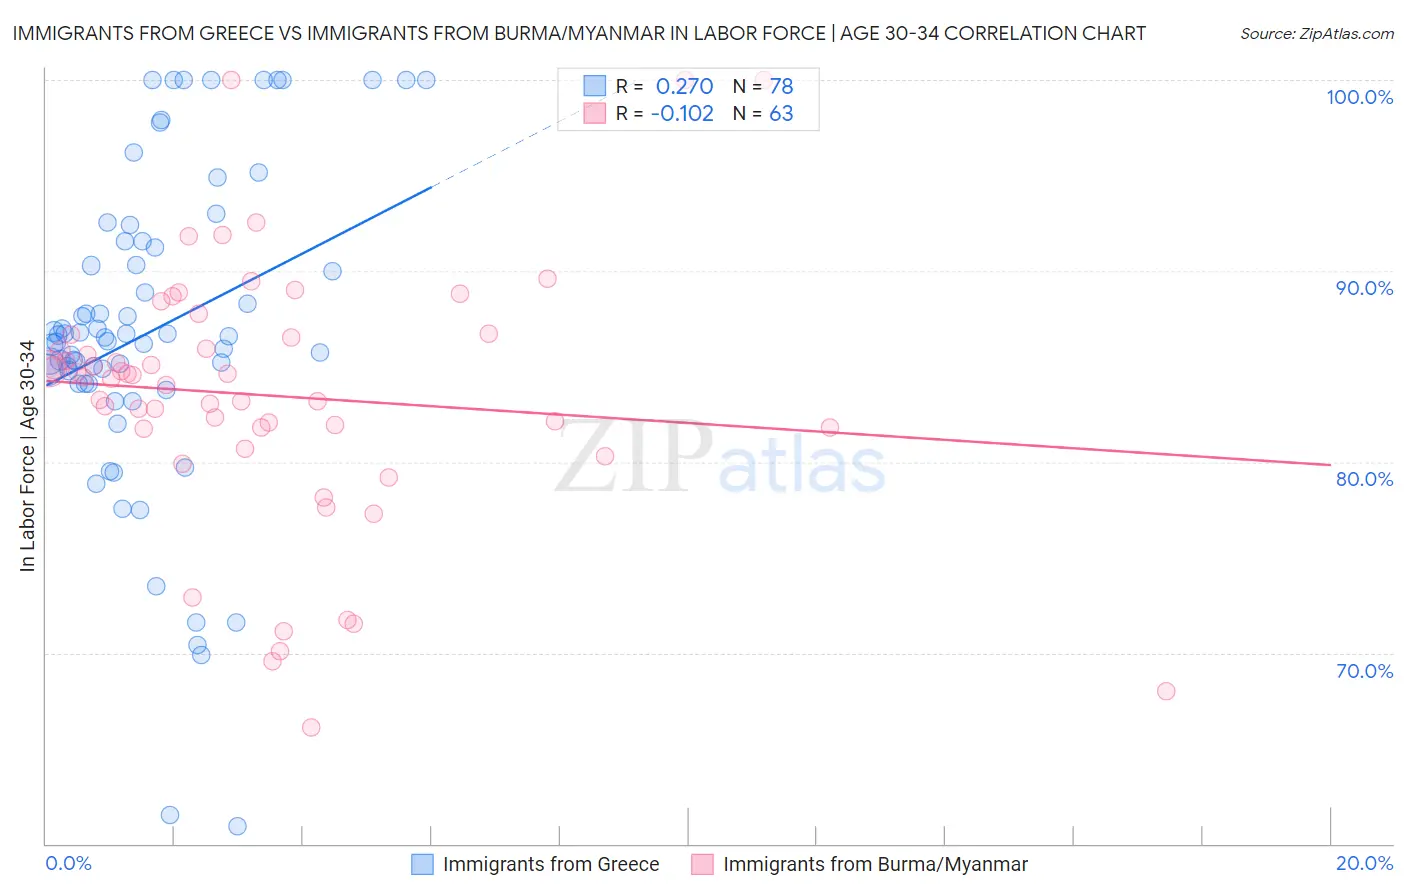
Immigrants from Greece vs Immigrants from Burma/Myanmar In Labor Force | Age 30-34 Correlation Chart

The statistical analysis conducted on geographies consisting of 216,816,273 people shows a weak positive correlation between the proportion of Immigrants from Greece and labor force participation rate among population between the ages 30 and 34 in the United States with a correlation coefficient (R) of 0.270 and weighted average of 85.7%. Similarly, the statistical analysis conducted on geographies consisting of 172,303,659 people shows a poor negative correlation between the proportion of Immigrants from Burma/Myanmar and labor force participation rate among population between the ages 30 and 34 in the United States with a correlation coefficient (R) of -0.102 and weighted average of 84.7%, a difference of 1.2%.
Immigrants from Greece vs Immigrants from Burma/Myanmar In Labor Force | Age 30-34

In Labor Force | Age 30-34 Correlation Summary

MeasurementImmigrants from GreeceImmigrants from Burma/Myanmar
Minimum60.9%66.1%
Maximum100.0%100.0%
Range39.1%33.9%
Mean86.9%83.5%
Median86.6%84.4%
Interquartile 25% (IQ1)84.1%81.8%
Interquartile 75% (IQ3)91.5%86.7%
Interquartile Range (IQR)7.4%4.9%
Standard Deviation (Sample)8.4%6.9%
Standard Deviation (Population)8.3%6.9%

Similar Demographics by In Labor Force | Age 30-34

Demographics Similar to Immigrants from Greece by In Labor Force | Age 30-34

In terms of in labor force | age 30-34, the demographic groups most similar to Immigrants from Greece are Albanian (85.7%, a difference of 0.010%), Norwegian (85.7%, a difference of 0.010%), Ugandan (85.8%, a difference of 0.020%), Serbian (85.8%, a difference of 0.020%), and Immigrants from Bosnia and Herzegovina (85.8%, a difference of 0.030%).
DemographicsRating | RankIn Labor Force | Age 30-34
Paraguayans
99.9
/100
|
#31
Exceptional
85.8%
Cypriots
99.9
/100
|
#32
Exceptional
85.8%
Immigrants | Bosnia and Herzegovina
99.9
/100
|
#33
Exceptional
85.8%
Ugandans
99.9
/100
|
#34
Exceptional
85.8%
Serbians
99.9
/100
|
#35
Exceptional
85.8%
Albanians
99.9
/100
|
#36
Exceptional
85.7%
Norwegians
99.9
/100
|
#37
Exceptional
85.7%
Immigrants | Greece
99.9
/100
|
#38
Exceptional
85.7%
Eastern Europeans
99.9
/100
|
#39
Exceptional
85.7%
Turks
99.9
/100
|
#40
Exceptional
85.7%
Immigrants | Italy
99.9
/100
|
#41
Exceptional
85.7%
Zimbabweans
99.8
/100
|
#42
Exceptional
85.6%
Immigrants | Lithuania
99.8
/100
|
#43
Exceptional
85.6%
Immigrants | Sri Lanka
99.8
/100
|
#44
Exceptional
85.6%
Immigrants | Nepal
99.8
/100
|
#45
Exceptional
85.6%

Demographics Similar to Immigrants from Burma/Myanmar by In Labor Force | Age 30-34

In terms of in labor force | age 30-34, the demographic groups most similar to Immigrants from Burma/Myanmar are Immigrants from Peru (84.7%, a difference of 0.0%), South American Indian (84.7%, a difference of 0.0%), Irish (84.7%, a difference of 0.0%), Immigrants from England (84.7%, a difference of 0.0%), and Israeli (84.7%, a difference of 0.010%).
DemographicsRating | RankIn Labor Force | Age 30-34
Immigrants | Uruguay
57.4
/100
|
#163
Average
84.7%
Icelanders
56.8
/100
|
#164
Average
84.7%
Immigrants | Western Europe
56.7
/100
|
#165
Average
84.7%
Afghans
55.2
/100
|
#166
Average
84.7%
Immigrants | South Eastern Asia
54.2
/100
|
#167
Average
84.7%
Immigrants | Peru
52.4
/100
|
#168
Average
84.7%
South American Indians
52.1
/100
|
#169
Average
84.7%
Immigrants | Burma/Myanmar
52.0
/100
|
#170
Average
84.7%
Irish
52.0
/100
|
#171
Average
84.7%
Immigrants | England
51.7
/100
|
#172
Average
84.7%
Israelis
51.1
/100
|
#173
Average
84.7%
Finns
50.0
/100
|
#174
Average
84.7%
Immigrants | South America
50.0
/100
|
#175
Average
84.7%
Immigrants | Uzbekistan
49.1
/100
|
#176
Average
84.7%
Laotians
46.9
/100
|
#177
Average
84.7%