Navajo vs Immigrants from Albania In Labor Force | Age 20-24
COMPARE
Navajo
Immigrants from Albania
In Labor Force | Age 20-24
In Labor Force | Age 20-24 Comparison
Navajo
Immigrants from Albania
64.8%
IN LABOR FORCE | AGE 20-24
0.0/ 100
METRIC RATING
347th/ 347
METRIC RANK
74.2%
IN LABOR FORCE | AGE 20-24
4.3/ 100
METRIC RATING
230th/ 347
METRIC RANK
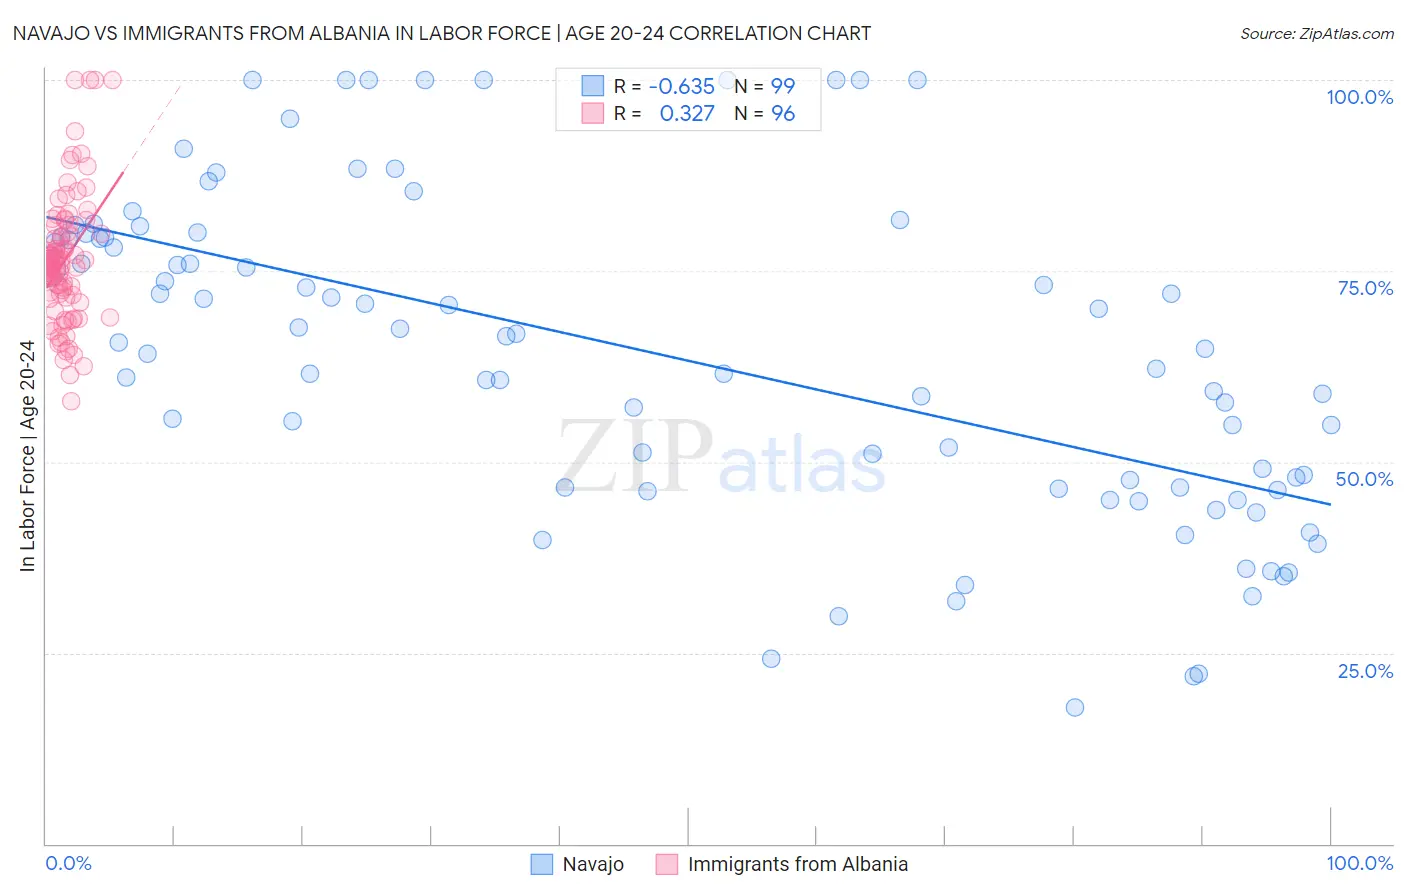
Navajo vs Immigrants from Albania In Labor Force | Age 20-24 Correlation Chart
The statistical analysis conducted on geographies consisting of 224,781,788 people shows a significant negative correlation between the proportion of Navajo and labor force participation rate among population between the ages 20 and 24 in the United States with a correlation coefficient (R) of -0.635 and weighted average of 64.8%. Similarly, the statistical analysis conducted on geographies consisting of 119,383,108 people shows a mild positive correlation between the proportion of Immigrants from Albania and labor force participation rate among population between the ages 20 and 24 in the United States with a correlation coefficient (R) of 0.327 and weighted average of 74.2%, a difference of 14.4%.
In Labor Force | Age 20-24 Correlation Summary
| Measurement | Navajo | Immigrants from Albania |
| Minimum | 17.9% | 58.0% |
| Maximum | 100.0% | 100.0% |
| Range | 82.1% | 42.0% |
| Mean | 63.8% | 76.4% |
| Median | 64.7% | 75.7% |
| Interquartile 25% (IQ1) | 46.6% | 71.7% |
| Interquartile 75% (IQ3) | 79.4% | 80.0% |
| Interquartile Range (IQR) | 32.8% | 8.3% |
| Standard Deviation (Sample) | 21.0% | 8.4% |
| Standard Deviation (Population) | 20.9% | 8.3% |
Similar Demographics by In Labor Force | Age 20-24
Demographics Similar to Navajo by In Labor Force | Age 20-24
In terms of in labor force | age 20-24, the demographic groups most similar to Navajo are Lumbee (65.5%, a difference of 1.1%), Hopi (66.0%, a difference of 1.8%), Immigrants from Grenada (67.2%, a difference of 3.6%), Puerto Rican (68.3%, a difference of 5.4%), and Immigrants from St. Vincent and the Grenadines (68.4%, a difference of 5.5%).
| Demographics | Rating | Rank | In Labor Force | Age 20-24 |
| Yuman | 0.0 /100 | #333 | Tragic 70.3% |
| British West Indians | 0.0 /100 | #334 | Tragic 70.0% |
| Immigrants | Barbados | 0.0 /100 | #335 | Tragic 69.7% |
| Immigrants | Guyana | 0.0 /100 | #336 | Tragic 69.3% |
| Guyanese | 0.0 /100 | #337 | Tragic 69.2% |
| Pima | 0.0 /100 | #338 | Tragic 69.0% |
| Immigrants | Yemen | 0.0 /100 | #339 | Tragic 68.9% |
| Menominee | 0.0 /100 | #340 | Tragic 68.7% |
| Tohono O'odham | 0.0 /100 | #341 | Tragic 68.6% |
| Immigrants | St. Vincent and the Grenadines | 0.0 /100 | #342 | Tragic 68.4% |
| Puerto Ricans | 0.0 /100 | #343 | Tragic 68.3% |
| Immigrants | Grenada | 0.0 /100 | #344 | Tragic 67.2% |
| Hopi | 0.0 /100 | #345 | Tragic 66.0% |
| Lumbee | 0.0 /100 | #346 | Tragic 65.5% |
| Navajo | 0.0 /100 | #347 | Tragic 64.8% |
Demographics Similar to Immigrants from Albania by In Labor Force | Age 20-24
In terms of in labor force | age 20-24, the demographic groups most similar to Immigrants from Albania are Immigrants from Greece (74.2%, a difference of 0.020%), Immigrants from Switzerland (74.2%, a difference of 0.020%), Immigrants from Sweden (74.2%, a difference of 0.030%), Immigrants from Ukraine (74.2%, a difference of 0.060%), and Immigrants from Chile (74.1%, a difference of 0.060%).
| Demographics | Rating | Rank | In Labor Force | Age 20-24 |
| Hispanics or Latinos | 7.9 /100 | #223 | Tragic 74.4% |
| Seminole | 6.9 /100 | #224 | Tragic 74.3% |
| Ghanaians | 6.2 /100 | #225 | Tragic 74.3% |
| Immigrants | Fiji | 5.9 /100 | #226 | Tragic 74.3% |
| Immigrants | Ireland | 5.8 /100 | #227 | Tragic 74.3% |
| Immigrants | Ukraine | 5.1 /100 | #228 | Tragic 74.2% |
| Immigrants | Sweden | 4.6 /100 | #229 | Tragic 74.2% |
| Immigrants | Albania | 4.3 /100 | #230 | Tragic 74.2% |
| Immigrants | Greece | 4.1 /100 | #231 | Tragic 74.2% |
| Immigrants | Switzerland | 4.1 /100 | #232 | Tragic 74.2% |
| Immigrants | Chile | 3.7 /100 | #233 | Tragic 74.1% |
| Immigrants | Immigrants | 3.6 /100 | #234 | Tragic 74.1% |
| Laotians | 3.5 /100 | #235 | Tragic 74.1% |
| Immigrants | France | 3.3 /100 | #236 | Tragic 74.1% |
| Bermudans | 3.2 /100 | #237 | Tragic 74.1% |