Russian vs Danish In Labor Force | Age 20-24
COMPARE
Russian
Danish
In Labor Force | Age 20-24
In Labor Force | Age 20-24 Comparison
Russians
Danes
74.8%
IN LABOR FORCE | AGE 20-24
32.2/ 100
METRIC RATING
190th/ 347
METRIC RANK
79.0%
IN LABOR FORCE | AGE 20-24
100.0/ 100
METRIC RATING
6th/ 347
METRIC RANK
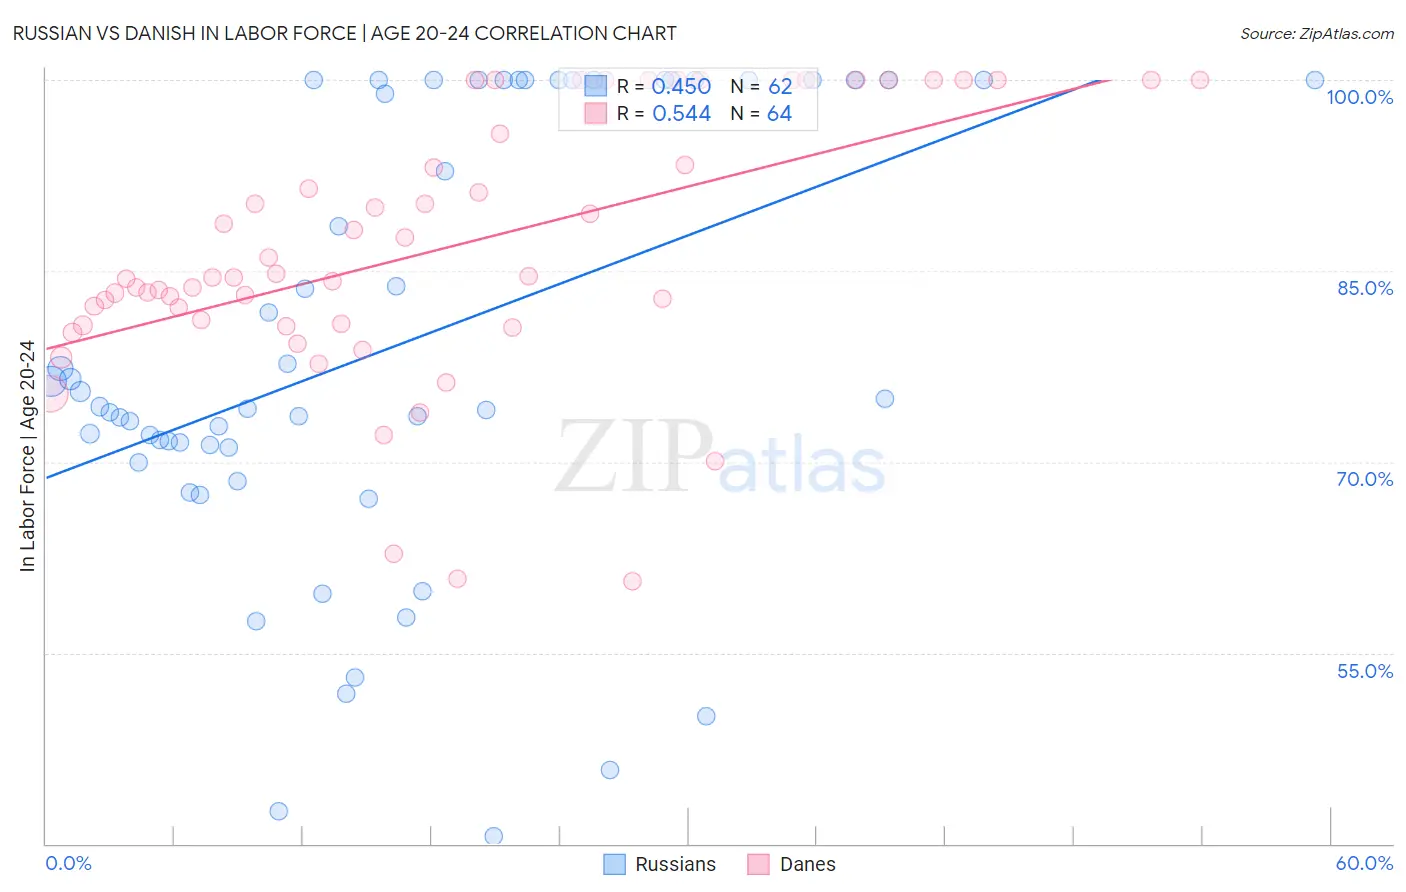
Russian vs Danish In Labor Force | Age 20-24 Correlation Chart
The statistical analysis conducted on geographies consisting of 511,601,024 people shows a moderate positive correlation between the proportion of Russians and labor force participation rate among population between the ages 20 and 24 in the United States with a correlation coefficient (R) of 0.450 and weighted average of 74.8%. Similarly, the statistical analysis conducted on geographies consisting of 473,606,493 people shows a substantial positive correlation between the proportion of Danes and labor force participation rate among population between the ages 20 and 24 in the United States with a correlation coefficient (R) of 0.544 and weighted average of 79.0%, a difference of 5.5%.
In Labor Force | Age 20-24 Correlation Summary
| Measurement | Russian | Danish |
| Minimum | 40.6% | 60.6% |
| Maximum | 100.0% | 100.0% |
| Range | 59.4% | 39.4% |
| Mean | 79.2% | 86.7% |
| Median | 74.7% | 84.5% |
| Interquartile 25% (IQ1) | 71.1% | 80.8% |
| Interquartile 75% (IQ3) | 100.0% | 97.9% |
| Interquartile Range (IQR) | 28.9% | 17.1% |
| Standard Deviation (Sample) | 17.3% | 10.2% |
| Standard Deviation (Population) | 17.1% | 10.1% |
Similar Demographics by In Labor Force | Age 20-24
Demographics Similar to Russians by In Labor Force | Age 20-24
In terms of in labor force | age 20-24, the demographic groups most similar to Russians are Honduran (74.8%, a difference of 0.010%), Immigrants from Northern Europe (74.8%, a difference of 0.010%), Immigrants from Honduras (74.9%, a difference of 0.020%), Immigrants from Eastern Europe (74.9%, a difference of 0.030%), and Immigrants from Hungary (74.9%, a difference of 0.050%).
| Demographics | Rating | Rank | In Labor Force | Age 20-24 |
| Immigrants | Costa Rica | 36.7 /100 | #183 | Fair 74.9% |
| Immigrants | Hungary | 35.0 /100 | #184 | Fair 74.9% |
| Sri Lankans | 34.9 /100 | #185 | Fair 74.9% |
| Immigrants | Eastern Europe | 33.8 /100 | #186 | Fair 74.9% |
| Immigrants | Honduras | 33.5 /100 | #187 | Fair 74.9% |
| Hondurans | 32.7 /100 | #188 | Fair 74.8% |
| Immigrants | Northern Europe | 32.6 /100 | #189 | Fair 74.8% |
| Russians | 32.2 /100 | #190 | Fair 74.8% |
| Senegalese | 28.1 /100 | #191 | Fair 74.8% |
| Immigrants | Europe | 27.5 /100 | #192 | Fair 74.8% |
| Alsatians | 27.1 /100 | #193 | Fair 74.8% |
| Immigrants | Denmark | 25.8 /100 | #194 | Fair 74.8% |
| Eastern Europeans | 25.4 /100 | #195 | Fair 74.8% |
| Immigrants | Vietnam | 25.1 /100 | #196 | Fair 74.7% |
| Panamanians | 25.0 /100 | #197 | Fair 74.7% |
Demographics Similar to Danes by In Labor Force | Age 20-24
In terms of in labor force | age 20-24, the demographic groups most similar to Danes are Aleut (79.0%, a difference of 0.010%), Luxembourger (79.0%, a difference of 0.040%), Alaskan Athabascan (79.1%, a difference of 0.15%), Immigrants from Cabo Verde (78.9%, a difference of 0.15%), and Swedish (78.8%, a difference of 0.21%).
| Demographics | Rating | Rank | In Labor Force | Age 20-24 |
| Norwegians | 100.0 /100 | #1 | Exceptional 80.1% |
| Immigrants | Somalia | 100.0 /100 | #2 | Exceptional 79.5% |
| Somalis | 100.0 /100 | #3 | Exceptional 79.3% |
| Alaskan Athabascans | 100.0 /100 | #4 | Exceptional 79.1% |
| Aleuts | 100.0 /100 | #5 | Exceptional 79.0% |
| Danes | 100.0 /100 | #6 | Exceptional 79.0% |
| Luxembourgers | 100.0 /100 | #7 | Exceptional 79.0% |
| Immigrants | Cabo Verde | 100.0 /100 | #8 | Exceptional 78.9% |
| Swedes | 100.0 /100 | #9 | Exceptional 78.8% |
| Slovenes | 100.0 /100 | #10 | Exceptional 78.7% |
| Finns | 100.0 /100 | #11 | Exceptional 78.7% |
| Germans | 100.0 /100 | #12 | Exceptional 78.6% |
| Scandinavians | 100.0 /100 | #13 | Exceptional 78.5% |
| Czechs | 100.0 /100 | #14 | Exceptional 78.5% |
| Sudanese | 100.0 /100 | #15 | Exceptional 78.4% |